
Research Notes
Volatility, A Skewed Reality
In the previous installment of our volatility series, I explained what volatility is and how it relates to investing. I also introduced the concept of the divergence between arithmetic returns and geometric returns, and how volatility exacerbates this phenomenon, which is often referred to as volatility drag. Volatility drag is something that is often debated by investment managers and investors alike. A common argument is that while higher volatility increases your downside, it can also increase your potential upside and therefore it may be rational to be risk-seeking to some extent. Another argument is that with a long enough time horizon, investors don’t actually need to worry about volatility because they can tolerate the ups and downs of the market. I will explore the former argument in this part of the series, while going further into the mechanics of why volatility matters with concrete examples using simple Monte Carlo simulations.
The Scenario
Suppose you are an investor with $1,000,000 and a goal of doubling your money to $2,000,000 over the next 20 years, because you have calculated that this is the amount of wealth required to retire comfortably. You are given the following three options to invest in, with the condition that the investment must be locked in for the next 20 years with no deposits or withdrawals:
Since a 5% average return compounded over 20 years will give you just over $2,500,000 on average, it is easy to assume that any of these portfolios will easily get you to your goal, so it doesn’t matter which portfolio is selected. However, volatility does matter and can greatly influence the outcome. It is not the average result that matters, because even though the average expected return may be equivalent across scenarios, the probabilities of achieving various ending portfolio values differs due to volatility. I will show that the average expected return is not actually representative of the average investor’s experience when volatility is introduced.
Analysis
The following analysis will explore the hypothesis that higher volatility decreases an investor’s chances of achieving a given wealth target and that volatility is just a measure of uncertainty, which can inform us about shortfall risk – the risk of not hitting a target portfolio value within a certain timeframe. In this analysis, using each of the above-mentioned hypothetical portfolio options, I run a Monte Carlo simulation to create 2,500 unique portfolio return paths for each of the above investment options. A Monte Carlo simulation is a tool that can be used to help visualize the potential outcomes of a scenario where uncertainty is involved by generating random samples given a statistical distribution to follow and the parameters of that distribution. In this case, that means that the output of the Monte Carlo simulation will be 2,500 ending portfolio values for each of the investment options, based on their return and volatility expectations. The analysis will assume that returns follow a normal distribution for the sake of simplicity. This serves to give us a distribution of probable outcomes for an investor, because, of course, the path of portfolio returns is unknown going forward. The question I wanted to answer is: How does volatility affect the probability that a specific wealth target will be achieved? The following chart shows the proportion of scenarios (y-axis) that achieve the $2,000,000 target out of the 2,500 scenarios at various levels of volatility (x-axis).
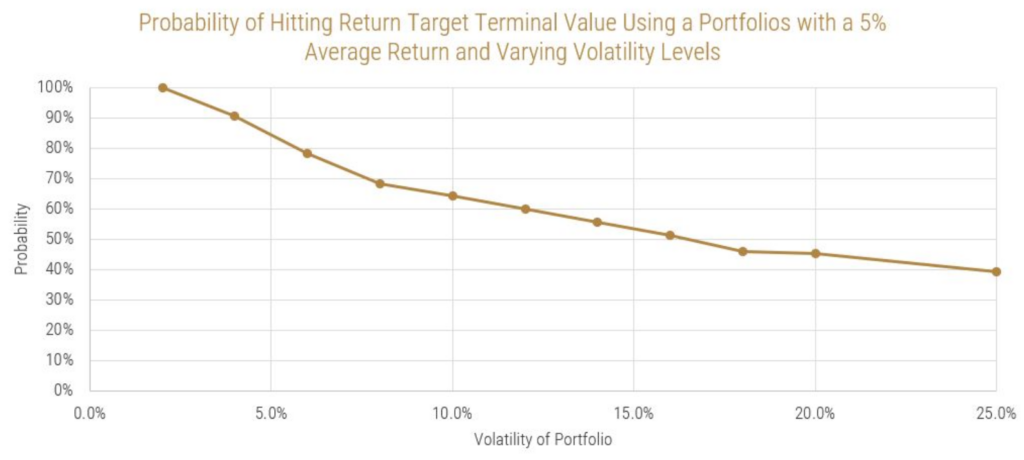
This essentially shows that as volatility increases, shortfall risk also increases. At first, it seems counterintuitive that a 5% average annual return over 20 years could result in an outcome where the probability of doubling the initial portfolio value money is less than 50% in higher volatility scenarios, when the average outcome of all scenarios resulted in a 2.5X outcome. However, as I will show through this analysis, it is not the average outcome that matters, but rather the median that investors should be concerned about.
The following histograms depict the occurrence of wealth levels after 20 years from the 2,500 scenarios for each of the given investment options. The bars coloured red represent outcomes in which the target wealth level ($2,000,000) is not achieved. Additionally, the yellow line represents the average terminal wealth value and the black line represents the median terminal wealth value from all 2,500 scenarios. As a reminder, the median is the point where half of all outcomes exist to the left of the line, while the other half exist to the right of the line.
The statistics from these distributions, for any of those who are interested, are also summarized in the table below:
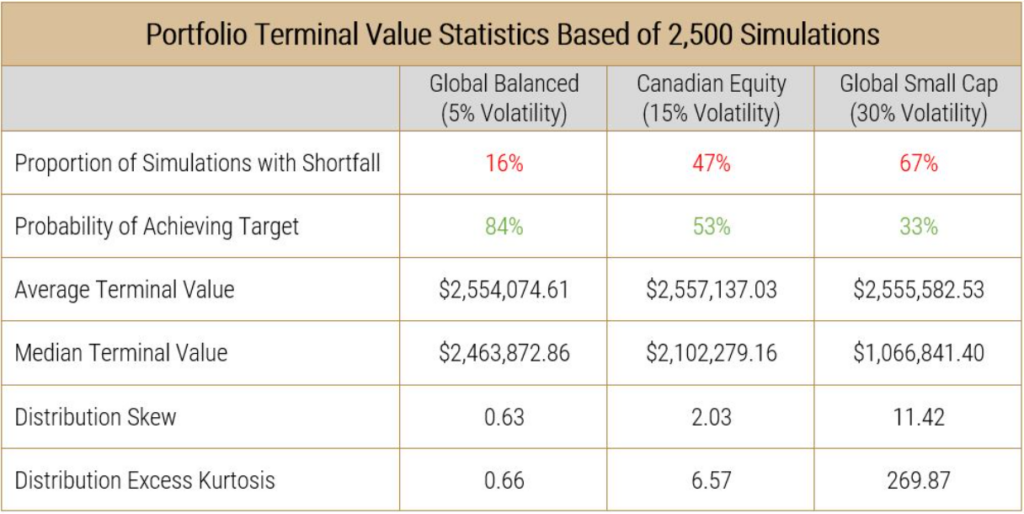
A few important things about the shape of the data can be noted here.
- Firstly, even though the inputs that went into creating the data assumed a normal distribution (average annual return and annual standard deviation of return), the distribution of outcomes is not normally distributed. A perfect normal distribution would result in a skew and excess kurtosis of 0. The data instead exhibits a positive skew (long right tail) and positive excess kurtosis (higher prevalence of outliers). The skew and kurtosis statistics increase in magnitude as volatility increases.
- The next thing the data shows us is that, as assumed, the average outcome occurs around the same level in each set of distributions. These averages converge even more as the number of simulations is increased, showing us that this was not by luck.
- The third and most important observation is that the median of each distribution always exists to the left of the average (mean). As volatility increases, the median deviates more from the mean to the point where the median for the 30% volatility scenario exists well inside the “red zone.” The deviation between the mean and the median shows the effect of volatility drag on the average investor’s portfolio, which is distinctly different from the average of all investor portfolios. This shows that holding all else equal, as volatility increases, the probability for unfavourable outcomes also increases, which in turn shows why shortfall risk increases in scenarios with higher volatility.
Conclusion
The above analysis on volatility can be summarized as follows:
For an individual investor, the measure of central tendency that matters the most is the median rather than the mean. Unlike a Monte Carlo simulation, investors don’t have the luxury of taking the average of 2,500 different paths; they only get to follow one path and so the median represents the average investor’s experience. As such, to avoid shortfall risk, investors must select the path with the least volatile return profile, all else being equal. It is now also clear that even if we weren’t concerned about shortfall risk and just cared about maximizing wealth, volatility is an important consideration. If presented with options that share the same return profile and varying risk profiles, using a probabilistic decision-making framework, as rational investors, we should always choose the one with the least risk.
In the next entry in our volatility series, I will explore how constraints like time horizon and liquidity needs affect an investor’s ability to tolerate risk and show how volatility matters even more for some.
ABOUT THE AUTHOR

DISCLAIMER:
This blog and its contents are for informational purposes only. Information relating to investment approaches or individual investments should not be construed as advice or endorsement. Any views expressed in this blog were prepared based upon the information available at the time and are subject to change. All information is subject to possible correction. In no event shall Viewpoint Investment Partners Corporation be liable for any damages arising out of, or in any way connected with, the use or inability to use this blog appropriately.