
Research Notes
Going the Distance: How to Conquer the Challenges Imposed by Liquidity Requirements
In Part 1 of our blog series, Understanding Risk, I introduced readers to the concept of volatility as a measure of risk and uncertainty, in addition to discussing the potential impact that volatility could have on wealth and that wealth is dependent on the path that returns take. In Part 2, I further illustrated this concept by running scenario analyses on three portfolios with the same expected return but with varying levels of volatility, and demonstrated that volatility negatively impacts the certainty with which an investor can achieve his or her wealth targets.
In this installment of our deep dive on volatility, I’ll be exploring how portfolio constraints affect an investor’s ability to take risk. When building an investment portfolio for a client, one of the first steps that needs to be taken is the construction of an Investment Policy Statement (IPS) – a document that helps portfolio managers determine, among other things, their clients’ risk tolerance based on a variety of constraints. The constraints that need to be considered are time horizon, taxes, liquidity needs, legal considerations, and unique issues. As some of these constraints are either too complex (e.g., taxes) or not easily quantifiable (e.g., legal and unique considerations), I will focus on illustrating how time horizon and liquidity needs affect an investor’s ability to take risk.
For the sake of both simplicity and continuity, I will be using the scenarios from Part 2 of this series as the baseline of comparison in the following analyses.
Liquidity Needs
In my previous blog post, we assumed that an investor had a lump sum of $1,000,000 to invest over a 20-year period, with the intent of doubling his money using one of three investment vehicles that each had an expected return of 5% per year with varying levels of volatility. In reality, portfolios are rarely left to compound over 20 years, but rather they are either drawn upon as cash flow needs arise or added to as wealth is created through other means. Consider the following scenarios:
-
Jane is an orthopedic surgeon who has just paid off her student debt and mortgage, and she would like to start investing. She has no current investments and wants to retire in 20 years with a portfolio worth $2,000,000. She has determined that she can put aside $80,000 per year to invest in this goal.
-
Max is a high school teacher and father of four. He has just received an inheritance of $1,000,000 and is also 20 years from retirement. Max has determined that he won’t be able to save any extra money annually after supporting his family, and he wishes to invest his inheritance as a lump sum with the goal of retiring with a portfolio worth $2,000,000.
-
Sally is a retired lawyer who has accumulated a nest egg of $2,000,000. She believes that she will need $80,000 per year to maintain her lifestyle for the next 20 years, at which point she hopes to pass on a portfolio worth $2,000,000 to her grandchildren.
Each of these investors has access to only one of the following investment vehicles for the next 20 years:
-
Global Balanced Portfolio: 5% expected annual return, 5% annual volatility
-
Canadian Equity Portfolio: 5% expected annual return, 15% annual volatility
-
Emerging Market (EM) Small Cap Equity Portfolio: 5% expected return, 30% annual volatility
It has already been established that given the same expected return, investors should always pick the lowest volatility investment vehicle. However, what we are trying to uncover through this illustration is whether or not liquidity needs have an effect on how impactful volatility is to a person’s long-term wealth. Each of the above scenarios has been set up such that in the absence of volatility, their terminal values would be exactly equal, resulting in a fair comparison. To test the effect of liquidity needs on ability to tolerate volatility, I will once again build a Monte Carlo simulation that outputs a distribution of terminal values for each scenario. The following table summarizes the probability of each investor hitting his or her wealth target using each investment vehicle:
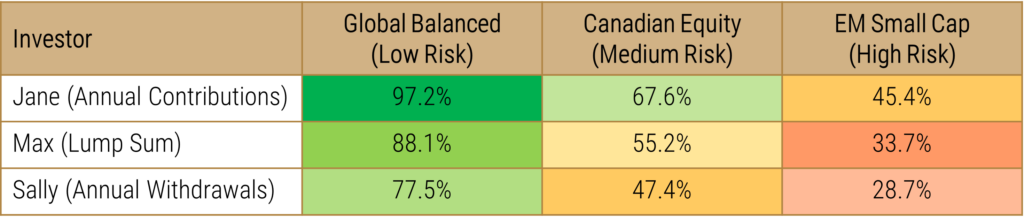
Liquidity requirements and the ability to contribute to a portfolio over time have significant and opposite impacts on terminal wealth values when compared to the lump sum portfolio. Jane has an increased ability to tolerate volatility compared to both Max and Sally, because of her ability to dollar cost average her entry points into the investment. On the other hand, Sally has a very low tolerance for volatility, because of her requirement to draw on the capital of the portfolio on an annual basis. This can be further illustrated by looking at how different the distributions are for each scenario:


The stark difference between Jane and Sally’s distributions drives home the impact of liquidity requirements on risk tolerance. As she invests in higher volatility portfolios, Sally’s probable outcomes become more and more skewed with a so-called “average” outcome being quite improbable. In fact, in the highest volatility scenario, most of the outcomes exist in the far extremes (tails) of the distribution, with almost half leading to near or full financial ruin. Contrasting this with Jane’s distribution of probable outcomes, it can be observed that extreme outcomes have a much lower representation in all volatility scenarios.
Time Horizon
Time horizon is an interesting topic when it comes to an investor’s ability to tolerate volatility in a portfolio. Conventional investing wisdom tells us that the longer an investor’s time horizon, the more readily they can handle the ups and downs of the market. This seems intuitive as it means that the investor can try to avoid selling at the worst times (e.g., during a market crash) and can allow his or her investment to compound over time. While all of this is true, a longer time horizon means that volatility drag can become more impactful. Using the same framework as before, I will aim to illustrate that simply having a longer time horizon may not in fact lower an investor’s ability to take risk. Consider the following scenarios:
-
Steve is an entrepreneur that has just sold one of his businesses for $1,000,000. He has earmarked this cash to invest for the next 10 years in hopes of buying a summer home for just over $1,400,000.
-
Max is a high school teacher and father of four. He has just received an inheritance of $1,000,000 and is 20 years from retirement. He has determined that he won’t be able to save any extra money annually after supporting his family, and he wishes to invest his inheritance as a lump sum with the goal of retiring with a portfolio worth $2,000,000.
-
Jenna is a wealthy retiree who has bequeathed a gift of just over $2,800,000 to her local university that is to be transferred in 30 years. She has put $1,000,000 in an investment account in order to fund this gift in the future.
The above scenarios have an equivalent required annual return so that the comparison between them is fair. Once again, the investors in these scenarios have the same three investment options as have been presented in prior scenarios, which all have a 5% average expected return and varying levels of volatility. Below is a table that summarizes the probability of reaching their respective wealth targets when investing in each option:

At first glance, it looks like low-risk investments respond well to a longer time horizon and high-risk investments respond poorly. It seems that we find a sort of equilibrium in our medium-risk scenario where the effect of time horizon and the compounding nature of volatility drag balance each other out for this set of scenarios. Again, to understand the full picture of what’s happening, it’s helpful to visualize the shape of the data:
In general, longer time horizons exhibit higher positive skew (longer right tail) and greater kurtosis (fatter tails with more observations at the extremes). As more volatility is added, the effect on skew and kurtosis is exacerbated.
While it seems that a longer time horizon doesn’t actually increase an investor’s ability to take risk, it may increase their willingness to take risk due to the fact that they can adjust their goals as their overall wealth picture changes a bit more easily than someone with a shorter time horizon. This could have a net positive impact on an investor’s overall risk tolerance, which is something that I will explore further in the next installment of our volatility series.
Conclusion
The above findings related to cash flows and risk are quite interesting. Compared to the simple buy and hold portfolio, an investor that needs to draw down on their portfolio periodically is more exposed to negative outcomes at the beginning of the investment’s life. These negative outcomes are further exacerbated by the fact that subsequent withdrawals need to be made on a portfolio that has lost value, crystallizing these losses and making it even more difficult to gain the lost value back. On the other hand, adding money to the portfolio over time puts less weight on these early losses as less capital is invested early on.
With regard to time horizon, the findings may be a bit surprising for some readers. Longer-term investors are not immune to the effects of volatility just because they can wait for the market to recover. In reality, volatility drag applies to all time horizons and eats away at the value of the portfolio over time. Interestingly enough, it seems that low volatility portfolios benefited from a longer holding period, whereas high volatility portfolios exhibited larger effects from volatility drag as the time horizon was stretched out. In some cases, time horizon may reduce one’s ability to take risk even though it may increase an investor’s willingness to take risk.
The next part of the series will lay out a simple probabilistic model for understanding an investor’s risk tolerance and will introduce varying return expectations into the mix to give us a full picture of how to determine the suitability of an investment vehicle based on goals and constraints.
ABOUT THE AUTHOR

DISCLAIMER:
This blog and its contents are for informational purposes only. Information relating to investment approaches or individual investments should not be construed as advice or endorsement. Any views expressed in this blog were prepared based upon the information available at the time and are subject to change. All information is subject to possible correction. In no event shall Viewpoint Investment Partners Corporation be liable for any damages arising out of, or in any way connected with, the use or inability to use this blog appropriately.