
News & Insights
Monte Carlo Simulations: A Journey Down Many Paths
In a previous blog post by Viewpoint Investment Partners, Volatility, A Skewed Reality, Amin Haji, Manager, Research & Analytics, explored the probability of specific wealth targets being achieved over a 20-year period when comparing investments with similar annual returns but differing volatilities. To perform his analysis, he leveraged a simple but powerful tool: Monte Carlo simulations. This method is used to model the probability of different outcomes in a scenario where uncertainty is involved, to help understand the impact of risk and uncertainty. Confused as to what that really means? Let’s break it down!
When projecting what an investment could be worth 20 years in the future, we need to account for the uncertainty in upcoming returns. A simplifying methodology in determining realistic estimates for annual returns is to assume that they can be represented by a normal distribution, modelled off the expected average annual return and volatility for any given investment. If we randomly select returns from the distribution for each of the years, we can build a unique return path, where the cumulative product of the returns yields the terminal value for the investment. However, this represents just one of an infinite number of paths that the returns could take year-to-year. What if, instead of one path, we created thousands? Each path unique, with annual returns randomly selected in the same fashion. This is an example of a Monte Carlo simulation!
To demonstrate, let’s model a scenario outlined in the blog post that had an investor with $1,000,000 and a goal to double that amount over 20 years. Using a Monte Carlo simulation with an expected average annual return and volatility both at 5%, we can generate and plot numerous potential return paths, and then tally up what percentage of the terminal values achieves the given return goal:
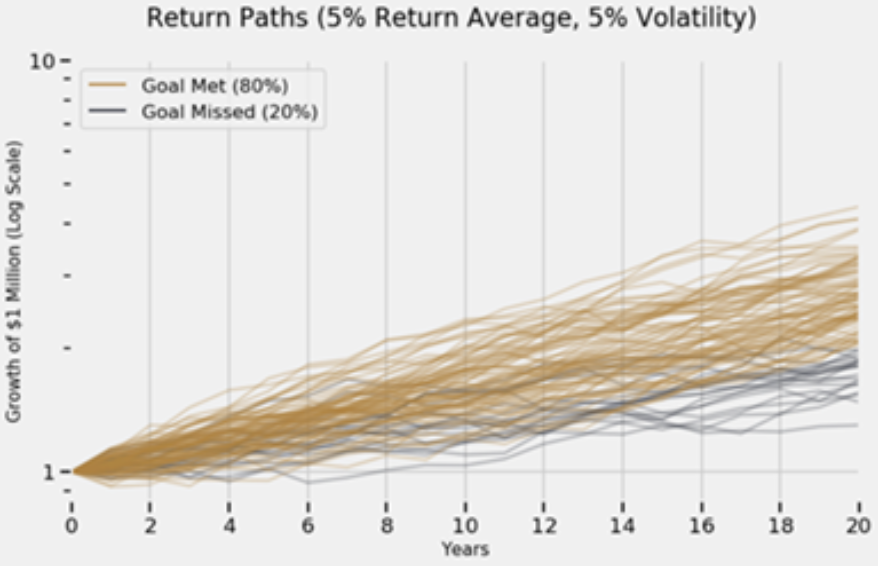
In contrast, we can then compare this against a simulation where the expected average annual return is still 5%, but the volatility is now 15%:

While the average annual return is the same in both scenarios, these Monte Carlo visualizations illustrate the dramatic impact that volatility (i.e., risk) has on the probability of achieving specific wealth targets.
To wrap this up, I will reiterate an important excerpt from the blog post’s findings: “Unlike a Monte Carlo simulation, investors don’t have the luxury of taking the average of 2,500 different paths; they only get to follow one path and so the median represents the average investor’s experience. As such, to avoid shortfall risk, investors must select the path with the least volatile return profile, all else being equal.“
ABOUT THE AUTHOR

DISCLAIMER:
This blog and its contents are for informational purposes only. Information relating to investment approaches or individual investments should not be construed as advice or endorsement. Any views expressed in this blog were prepared based upon the information available at the time and are subject to change. All information is subject to possible correction. In no event shall Viewpoint Investment Partners Corporation be liable for any damages arising out of, or in any way connected with, the use or inability to use this blog appropriately.