
Research Notes
One Size Doesn’t Fit All: Assessing Suitability in the Context of Uncertainty
My previous posts on volatility have covered what volatility is, why volatility matters, and how different constraints affect an investor’s ability to tolerate risk in the form of volatility. This installment in our volatility series will aim to provide a framework that helps to quantify an investor’s ability and willingness to take risk based on constraints and the importance of reaching wealth targets. Additionally, I will finally add varying returns into the analysis to illustrate the impact of the risk and return trade-off. Through simple examples and simulations, I will show that understanding an investor’s total financial picture and applying a probabilistic framework for risk management can help achieve desired outcomes in the face of uncertainty.
Probability-Based Framework for Assessing Portfolio Suitability
Today, the investment industry is heavily reliant on “Know Your Client” (KYC) questionnaires to provide mass customization of portfolio management solutions. Oftentimes, these consist of five to ten questions that place you into one of a few different risk buckets based on factors such as age, investment knowledge, and wealth level. Based on this information, you may be placed into a conservative strategy if you are deemed as having a low risk tolerance; conversely, you may be placed into a growth strategy if you have a high risk tolerance. While this is a step in the right direction and provides a more customized experience to the average investor, I believe that we can further quantify risk and return targets to provide a more holistic wealth management solution.
Much of what I have covered in my previous blog posts is about quantifying an investor’s ability to take risk. The other piece of the risk tolerance equation is an investor’s willingness to take risk. This topic is quite a bit more subjective and is harder to quantify, but I will aim to do just that within this framework. We can use the probabilities of achieving return targets as a proxy for an investor’s willingness to take risk. If, for example, you have someone who needs to hit a certain wealth target and wants to be 95% certain that they hit that wealth target, a suitable portfolio would be one that achieves that target with a 95% or greater probability. This person would also be said to have a low willingness to take risk, as they can only tolerate a 5% chance of failure. This framework will aim to use the following information to find the most suitable investment strategy for each investor:
Scenario Analysis
Let’s consider the following scenarios to put the framework to the test:
-
Harry is a young professional who is five years into his career. He has a goal of saving $40,000 every year until he retires, which he estimates will be 30 years from now. Currently, his portfolio is worth $200,000 and he has a target wealth of $5,000,000. He is willing to accept a high level of risk, because he knows that if his portfolio performs poorly, he will likely be able to adjust his lifestyle and savings rate to achieve his wealth target. As such, we will use a 50% confidence level to signify his willingness to take risk.
-
Margaret is 70 years old and is retired. Her current portfolio is worth $2,000,000 and she spends about $90,000 per year to maintain her lifestyle. She wants to protect her grandchildren’s inheritance and would like to ensure that in 15 years, her portfolio is still worth $1,000,000. She expresses that she has very little investment knowledge and would like to be about 95% certain of achieving her wealth target.
-
Kate is a single mom who is 20 years away from retirement. She estimates that she will require around $2,500,000 to retire comfortably and her current portfolio is worth $750,000. She estimates that she will be able to save $16,000 per year until retirement, but she doesn’t have a lot of ability to adjust her spending as market conditions change if she maintains her current standard of living. We will assign an 80% confidence level as a proxy for Kate’s willingness to take risk.
As was the case with previous scenarios, I will be constraining the available investment vehicles in the above cases to three options, of which only one can be chosen. In contrast to previous simulations, the investment vehicles will not only have varying volatility levels, but varying return levels as well to illustrate a more realistic set of options. The options can be found below:
-
High-Risk Portfolio: 9% expected annual return, 20% annual volatility
-
Medium-Risk Portfolio: 7% expected annual return, 12% annual volatility
-
Low-Risk Portfolio: 5% expected annual return, 7% annual volatility
To determine the most suitable investment option (or to see if any are suitable), we run each scenario through a Monte Carlo simulation (jump to Part 2 for definition) with an output of 2,500 outcomes given the above portfolio parameters. Next, we calculate the percentile at which the desired wealth target is achieved. If the percentile is greater than the desired level of certainty, the investment option is suitable – and the higher the percentile, the better the option.
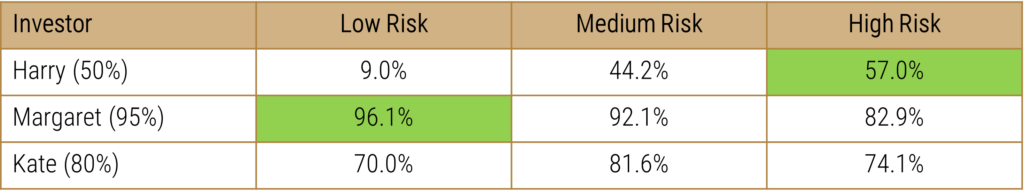
The following table shows each investor’s probability of reaching their wealth target while investing in each option. The options that achieve the wealth target with at least the stated level of certainty are highlighted.

There is an issue here in that there are no suitable portfolios in the investable universe for Kate given her wealth target and risk tolerance. This means that Kate must adjust her expectations somehow in order to reach her financial goals. Assuming that she is already doing her best to save every month, the only adjustments that can be made are to her final wealth target and/or her willingness to accept failure. Given that risk aversion is often a behavioural quality, adjusting her risk tolerance to make the numbers work is likely not the best course of action and may result in an adverse outcome that she is not prepared for. Instead, she will have to settle on a more realistic wealth target and plan to adjust her lifestyle during retirement accordingly. After doing some budgeting and speaking to a financial planner, Kate understands her financial picture a bit better and is willing to change her wealth target to $2,000,000. The updated investor table can be found below:
None of the investors in the above scenarios have the same optimal portfolio. This is an interesting outcome given what was discovered in previous examples throughout this blog series. The strategy that best suits one investor is not the most suitable for another based on their individual wealth targets, their time horizon and liquidity needs, and their willingness to accept and adapt to adverse outcomes.
To help us better visualize the above analysis, the following charts show the paths of simulated portfolios resulting in an outcome at the 60th, 70th, 80th, and 90th percentiles of confidence for Kate’s scenario invested in each of the investment strategy options. The endpoint of each line tells us that a proportion equal to the line’s corresponding percentile of confidence of all portfolios in the simulation resulted in an equal or greater terminal value, hence having x% confidence that the outcome will be at least that value.
A few interesting and important observations can be made here:
Conclusion
Investors are unique and have varying constraints and willingness to adjust to volatile conditions. As such, selecting an appropriate investment strategy is a bit more complicated than a short set of questions – like a KYC – may be able to answer. The scenarios laid out above are quite simple, but this framework is robust enough to handle a lot more complexity, such as variable cash flows and multiple wealth targets, with different levels of required confidence of achieving goals among other parameter adjustments. Though the model is quite simple, I hope that it provides readers with a more probabilistic and customizable way to approach investing and think about the relationship between volatility and returns.
ABOUT THE AUTHOR

DISCLAIMER:
This blog and its contents are for informational purposes only. Information relating to investment approaches or individual investments should not be construed as advice or endorsement. Any views expressed in this blog were prepared based upon the information available at the time and are subject to change. All information is subject to possible correction. In no event shall Viewpoint Investment Partners Corporation be liable for any damages arising out of, or in any way connected with, the use or inability to use this blog appropriately.