
Research Notes
Make Sure the Free Lunch Isn’t Moldy
Speed Read:
- The concept of diversification has a long history and is often considered “the only free lunch” in investing.
- The benefits of diversification are well studied in academic literature, but in practice, correlations between traditional assets like stocks and bonds can change, affecting the effectiveness of diversification.
- The correlation between U.S. stocks and U.S. bonds over the last twenty years is -0.3, but if you expand the time horizon to incorporate data going back to the 1970s, the correlation is closer to 0.
- When simulating the performance of a 60/40 balanced portfolio, adjusting the expected correlation between stocks and bonds from -0.3 to 0.0 decreases the expected Sharpe ratio of the portfolio by 16.3%.
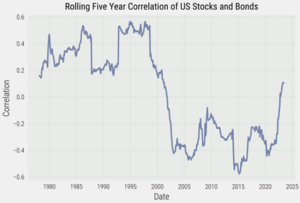
- With monetary policy tightening to combat rising inflation, the correlation between stocks and bonds has increased dramatically in a post-COVID world, with the rolling five-year correlation between the two assets currently at +0.1.
- The elevated levels of macroeconomic uncertainty make it challenging to rely on traditional diversification strategies, and asset allocators should look to fortify their investment portfolios with an asset class like commodities, which have the potential to do well in environments that are tenuous for stocks and bonds.
- While adding an allocation to commodities can help reinforce balanced portfolios, the correlation between commodities and financial assets is not static and can impact the performance of a well-diversified portfolio.
- To combat the unpredictability that changing correlations and volatility have on static capital weighted portfolios, asset allocators can utilize a risk-parity portfolio construction to help mitigate these issues.
- A risk-parity portfolio dynamically adjusts capital weightings based on evolving correlations and volatility, alleviating the need to forecast what will transpire in the future.
- Asset allocators can use a risk-parity portfolio construction to ensure the free lunch of diversification hasn’t gone moldy, and then apply prudent and liquid leverage to target a desired risk profile (e.g., global equity volatility) to ultimately feast on the improved Sharpe ratio.
![]()
Dining on a Free Lunch
Diversification is often referred to as the only free lunch in investing. The espoused benefits of diversification are not a new phenomenon, with reference to the practice of dividing your assets into thirds going all the way back to the Talmud, which was written close to 2,000 years ago. In more recent history, the creation of Modern Portfolio Theory (MPT) by Harry Markowitz in the 1950s quantified the benefits of diversification, providing investors with a novel way to view investment risk, which led to a renaissance for portfolio construction theory. Shortly after MPT was introduced to the world, the Capital Asset Pricing Model (CAPM) was created by William Sharpe and John Lintner and explored the relationship between expected returns and systematic risk. The CAPM model theorized that because investors can diversify a portfolio to reduce company specific risk, the only risks that investors should be compensated for bearing are systematic (non-diversifiable) risk factors. To capitalize on the magic of diversification, investors can combine assets with systematic risk factors that have low correlations to one another, thereby lowering overall portfolio volatility and improving risk-adjusted returns.
While “risk” is sometimes thought of in an absolute sense as the possibility of ruin (losing our entire investment), an equally important danger is what is known as “volatility drag.” Volatility drag is an insidious risk that arises from highly volatile investments and is generally unbeknownst to investors. We have previously written about why volatility matters to investors, showcasing that higher risk doesn’t necessarily mean higher returns will follow. Instead, higher volatility results in a larger difference between arithmetic (average yearly return) and geometric (path dependent compounded) returns, leading to a wider dispersion of potential investment outcomes. If your investment loses 50% in one period, you don’t need a positive 50% return in period two to be whole again – you need a return of 100%! The gap between the arithmetic return and geometric return is what is known as volatility drag. By reducing volatility, investors can fight back against the insidious risk of volatility drag and improve the probability of more predictable investment outcomes.
Whetting the Appetite for Diversification
With the goal of reducing volatility, the key catalyst involved in the alchemy of diversification is to add investments to a portfolio that have a low correlation to each other. When investments have a long-term positive expected return (“risk” that investors are compensated for bearing) but rise and fall at different times, investors can take advantage of the divergence in return streams by rebalancing back to target portfolio weights at regular intervals to improve risk-adjusted returns. The increase in geometric return from a lower volatility, more diversified portfolio is sometimes referred to as a “rebalancing premium.” In a 2006 paper from Erb and Harvey, the authors illustrated that a rebalanced portfolio of commodity futures can earn a positive “diversification return,” which Levine et al. expand on in a 2018 paper called Commodities for the Long Run. While the academic work showcasing how to “turn water into wine” (Erb-Harvey 2006) is specific to commodity markets, the same principles apply to the global multi-asset universe.
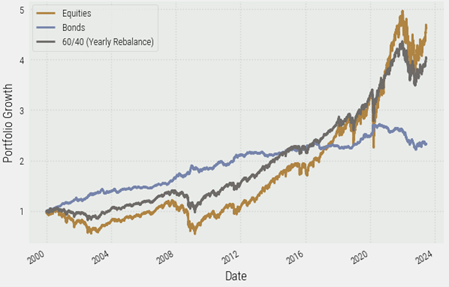
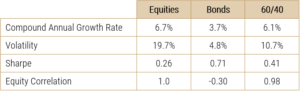
To illustrate the power of diversification, let’s look at the U.S. equity market from 2000 to 2023. U.S. stocks returned 6.7% on an annualized basis, with volatility of 19.7% and a Sharpe ratio (excess return per unit of risk) of 0.26. If an investor was to add a 40% allocation to bonds (turning this into a 60/40 balanced portfolio), the compound annual growth rate would have only fallen slightly, but volatility would have materially dropped (Figure 1 and Table 1). An investor would have sacrificed less than 0.6% of annualized return to see portfolio volatility nearly cut in half. By adding an asset class (bonds) that has a negative correlation to the portfolio (equities), an investor would have vastly improved the risk-adjusted returns of the portfolio, with the Sharpe ratio increasing from 0.26 to 0.41.
The last two decades highlight how powerful diversification can be for a portfolio when the asset classes involved have a negative correlation and a positive expected return. Portfolio construction doesn’t need to be complicated when something as simple as adding an allocation to bonds results in a material increase to the portfolio’s Sharpe ratio. However, was the performance of the 60/40 balanced portfolio over the last two decades an anomaly? Can asset allocators rely on the negative stock and bond correlation in the future?
The Fungus of Stock/Bond Correlation Decay
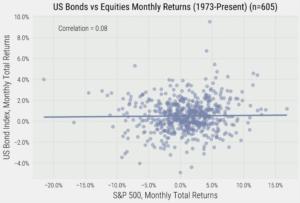
Expanding our time horizon to incorporate data going back to the 1970s, we can get a more fulsome picture of the correlation structure between U.S. stocks and U.S. bonds. What we find with a longer lookback window is that the monthly correlation between stocks and bonds is closer to 0.0, as opposed to the -0.3 figure experienced over the last two decades (Figure 2). As you might have guessed, the correlation structure of U.S. stocks and U.S. bonds also doesn’t remain static. Using a five-year rolling window to provide further context, you can see correlations between the two asset classes change quite materially over time (Figure 3). Dynamic correlation structures pose a challenge for asset allocators, as the benefits of diversification can change dramatically based on what current correlation structure is being exhibited, especially for portfolios using static capital weightings.
The macroeconomic landscape is currently exhibiting high levels of uncertainty, as monetary policy has shifted towards waging war on inflation, while fiscal policy remains accommodative. In an environment where monetary and fiscal policy are diverging with elevated levels of interest rates, the macroeconomic backdrop appears to be shifting into a new regime, one that may look more like the 1980s rather than the 2000s.
While we ultimately don’t know how correlations between stocks and bonds will evolve in the future, asset allocators need to be cognizant that a change from the most recent period will have implications on the robustness of 60/40 balanced portfolios.
To illustrate how changing correlations can affect portfolio risk, we can run simulations based on the expected returns and volatility for both stocks and bonds, changing only the correlation between the two asset classes. Figure 4 shows how adjusting correlations between stocks and bonds can affect the simulated risk-adjusted returns of the portfolio.
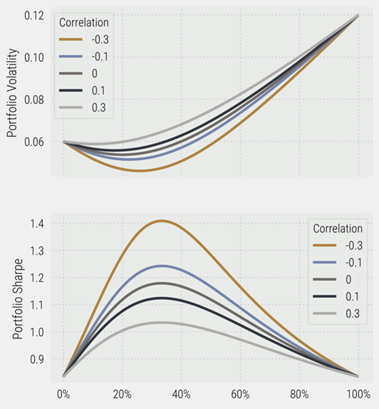
While the choice of how much capital allocated to stocks and bonds in a balanced portfolio will dictate how impactful changing correlations are to an investor’s portfolio, you can see that for a 60/40 balanced portfolio a negative correlation has a large positive impact. As shown in Figure 4, a longer-term correlation for stocks and bonds of 0.0, rather than the more recent -0.3, increases the expected volatility and the expected Sharpe ratio is reduced by 9.4% from 1.16 to 1.05.
Preserving the Investment Buffet with the Salt of Commodities
To make sure the free lunch of diversification isn’t growing mold, it is a worthwhile activity to look outside of stocks and bonds to build a more robust portfolio. An allocation to commodities can help fortify investment portfolios, as commodities have lower pairwise correlations to financial assets and tend to do well in environments where inflation surprises to the upside. Although bonds are generally thought of as a good diversifier to stocks because in financial stress situations bonds have historically gone up as equities are falling, there are certain environments (like 2022) when stocks and bonds can go down together. Bonds generally perform well in environments where growth and inflation are falling, while equities perform well when growth is rising or inflation is falling. Equities and bonds are susceptible to falling together in situations where inflation is rising and interest rates are moving higher as a result. It is important for portfolio construction purposes to have an allocation to assets like commodities and inflation-linked bonds, which can perform well in environments where inflation is rising.
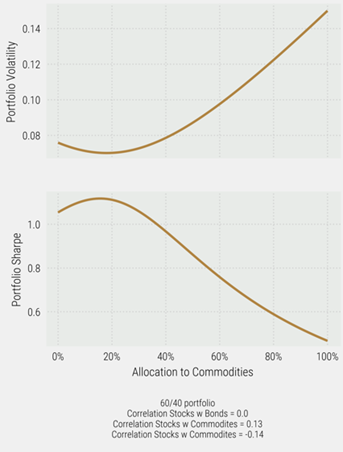
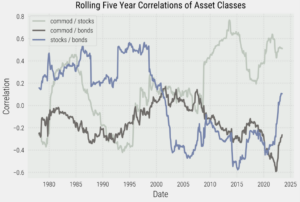
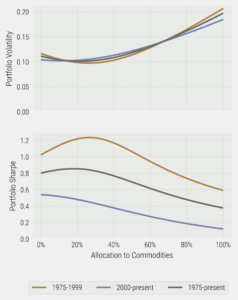
Going back to our portfolio simulations, if you take a 60/40 balanced portfolio where we assume a correlation between stocks and bonds will be 0.0, adding an allocation to commodities lowers the volatility and improves the risk-adjusted return of the portfolio (Figure 5). However, like in the above simulations of a 60/40 balanced portfolio, the correlation of commodities to stocks and bonds is integral to the diversification benefits they can provide to a portfolio. And, just like stocks and bonds, the correlation structure for commodities relative to financial assets are not static and do change materially (Figure 6.)
Using historical data for returns, volatilities, and correlations, and then segmenting that data into different periods (Figure 7), we can analyze how useful an allocation to commodities would have been in the past. We can see that over the last twenty years having an allocation to commodities hasn’t provided much in the way of benefits to a 60/40 balanced portfolio; although as we’ve noted above, it may be dangerous to assume this regime with a negative stock and bond correlation will continue to persist. There is a clear benefit to having an allocation to commodities in a static balanced portfolio over the full period, though this benefit is most pronounced from the 1970s to the 2000s.
With a highly uncertain macroeconomic environment, asset allocators may need to adjust their expectations that future correlations between stocks and bonds will remain static. If we are indeed entering a new macroeconomic regime, the diversification benefits harvested from a balanced 60/40 portfolio may be far less than what has been experienced over the past twenty years. The addition of commodities to a 60/40 balanced portfolio can help reinforce investment portfolios, especially in periods where stocks and bonds exhibit strong positive correlations. However, correlations aren’t static and can vary quite considerably over time. Therefore, investors need a better way to allocate capital, preferably one that can dynamically react to evolving correlations between asset classes. Because we don’t know with certainty what type of macroeconomic environment will prevail, and therefore what returns, volatilities, and correlations will end up materializing for the assets in the portfolio, a risk-parity approach to portfolio construction may help to enhance outcomes.
Risk Parity: Pasteurization for Your Portfolio
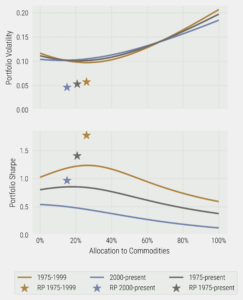
In a simple risk-parity framework, the capital allocation for each asset class is determined based on each asset’s contribution to portfolio risk and is driven by the volatility of each asset class, as well as its correlation to the other assets in the portfolio. By computing historical volatilities and correlations of each asset class, we can solve for the capital weight required so that each asset class contributes the same amount of “risk” to the portfolio. The best part about the risk-parity portfolio construction framework is that it takes the guesswork out of forecasting future volatilities and correlations. Each time the portfolio is rebalanced, the new capital weightings that reflect equal risk contribution incorporate updated volatilities and correlations. Figure 8 showcases the Sharpe ratio of the risk-parity portfolio for each period (denoted by a star) and how it dominates the Sharpe ratio for the optimal allocation to commodities in a static balanced portfolio. Because the asset allocations of the risk-parity portfolio are dynamic in nature, the position of each star in the graph relative to the x-axis is a function of the average allocation to commodities over that period. Figure 9 illustrates the dynamic nature of the asset allocation framework, providing the distribution of commodity weightings within the risk-parity portfolio for the full sample.

Feasting on the Diversification Premium
At Viewpoint, we believe that the most defensible way to steward capital is to use a risk-parity framework for your base layer portfolio construction. If you can accurately balance your risk profile to reflect evolving volatility and correlation structures, investment returns will follow. While free lunches sound appealing, asset allocators need to make sure that stale correlations or static capital weights haven’t turned the bread moldy. Asset allocators can then take the more efficient portfolio produced as part of the risk-parity framework and use prudent, liquid leverage to target a desired risk profile. By using prudent, liquid leverage to target a desired risk profile (e.g., the volatility of global stock markets) allocators can unlock the power of the diversification premium and feast on the benefits of an increased Sharpe ratio.
ABOUT THE AUTHORS


DISCLAIMER:
This blog and its contents are for informational purposes only. Information relating to investment approaches or individual investments should not be construed as advice or endorsement. Any views expressed in this blog were prepared based upon the information available at the time and are subject to change. All information is subject to possible correction. In no event shall Viewpoint Investment Partners Corporation be liable for any damages arising out of, or in any way connected with, the use or inability to use this blog appropriately.