
Research Notes
Risk Parity & Pension Portfolios: A Perfect Match
Geek Level:
Read Time:

The Speed Read:
- Growth sleeves within a pension’s asset-liability framework are built with the intention of improving funded status, but depending on the path of different macroeconomic drivers, these portfolios can lead to adverse outcomes due to risk mismatches.
- Key risks in future pension liabilities include growth (both wage and economic), interest rates, and inflation. Overreliance on the equity risk premium in the asset side of the portfolio means that protection for some of these factors is unbalanced or completely lacking.
- Risk parity – or, more broadly, risk allocation – is a tool that can more purposefully diversify across these risks without sacrificing return potential. We empirically prove that a risk parity portfolio is more robust in improving funded-status outcomes during different macro environments.
- Risk parity portfolios achieve better outcomes within the asset-liability framework, not only from a growth of funded-status perspective, but also from a funded-status volatility perspective, which serves as protection against the timing of cash needs.
- Individuals can think about their financial portfolios as pensions for themselves, their future generations, or their philanthropic causes. Therefore, it stands to reason that the more robust portfolio solution that we describe in this research note will work well for individual investors and wealth managers.
Mind Your Assets… And Your Liabilities Too
As some of the largest vehicles for investor savings in the world, pension plans come with a high degree of nuance and complexity. Beneficiaries of the funds often depend on them for a significant proportion of their retirement spending, meaning that their financial security largely rests in the hands of the plan sponsors. Sponsors can vary from a large sovereign nation, to a purpose-built aggregator that serves workers of a specific type, to a corporation that runs its own pension for its employees. Each plan sponsor makes decisions to ensure that the fund can meet its obligations to the plan beneficiaries. The principal among these includes both accurately forecasting the future cash requirements of the fund and building an asset portfolio that can keep up with these cash requirements.
The forecasting of cash flows is mostly an actuarial exercise, including estimates for wage growth, changing demographics, beneficiary lifespans, and many other factors that are beyond the scope of this research note. These cash flows are ‘discounted’ in order to derive the present value of future liabilities. Without going into a lesson on the time value of money, the general underlying concept is that money in the future is worth less than money today, in part due to inflation, but more explicitly due to the ability to earn returns on cash in hand. We use something called a ‘discount rate,’ as its name implies, to reduce the value of future money and assign the appropriate value to it today. This is clear when thinking about assets that can generate returns, but it is worth some exploration when talking about liabilities, especially because this mechanism is important when discussing pension funds. Pension funds can theoretically hedge all future liabilities by holding fixed income portfolios, which pay interest and principal at the same time that cash flows are required in the future. So, in a very simple case, because the liabilities can be fully hedged in this way, it makes sense to discount the liability portfolio by the yield on that fixed income portfolio. If the asset portfolio that a pension fund manages has a market value that is equivalent to the present value of the liability portfolio, the pension is said to be fully funded or has a funded status of 100%. In practice, discount rates can take the form of the yield on a corporate bond, a composite rate that takes the risk factors within the liability portfolio into account more explicitly, or even a simple long-term expected return on a typical asset portfolio. Ultimately, the selection of an appropriate discount rate depends on a variety of factors including the regulatory environment within which the fund operates and the plan structure – defined benefit or defined contribution. [1] Our analysis in this research note focuses on defined benefit plans, as these are more onerous for plan sponsors and therefore require a higher attention to detail on the risk management side.
Traditional asset portfolios are generally concerned with the maximization of returns while managing tolerable levels of risk. This risk is often measured as volatility and some indication of downside potential, like maximum drawdown or value-at-risk (VaR). However, when faced with some level of certainty regarding the schedule of future cash requirements from a portfolio, such as a pension’s liabilities, it is more prudent to think of risk and return in relative terms. This approach is known as liability-driven investing (LDI) and can be contrasted with the more conventional total return approach to investing. Although LDI was understood and had been explored in the literature, some of the world’s largest pension plans still used a total return approach for many of their asset portfolios prior to the Great Financial Crisis (GFC) in 2008. The 2008 crash and subsequent cutting of interest rates led to record reductions in funded status due to a significant asset-liability mismatch. In turn, this caused a major shift in the degree to which pensions have since opted for a liability-driven approach. A typical portfolio utilizing the LDI approach has two components. The first is an explicit hedge that matches expected cash flows of future liabilities with a laddered bond portfolio using a process called ‘immunization.’ The second component is a more growth-oriented portfolio, which exists to improve funded status over the long term. Theoretically, a pension manager with a fully funded pension portfolio could fully immunize the liability portfolio by matching cash flows or hedge the portfolio by matching the duration and key rate durations between the asset and liability portfolio. However, in practice, this is rarely, if ever, done due to the uncertainty related to the estimated liability portfolio, which means even fully-funded or over-funded pension plans would still utilize a growth sleeve that attempts to keep up with factors that affect future benefit requirements. The allocation towards the growth portfolio varies based on the fund’s current funded status and its risk tolerance. In simple cases, the growth sleeve can take the form of an all-equity or balanced (60% in equities and 40% in fixed income) asset allocation. These conventional growth sleeves are heavily dependent on equity market performance, which only provides exposure to one of the risk factors – economic growth – that drive the uncertainty of future cash requirements. Consequently, they do a poor job of managing funded-status risk and therefore – as illustrated during the GFC – should responsibly constitute only a small proportion of the pension’s assets. This, however, can pose a significant challenge, as it becomes more difficult – and more risky – for pension managers to utilize these growth sleeves to improve funded-status outcomes.
Finding the Ideal Mix: Not from Concentrate
When looking at corporate pension plans specifically, this reliance on the equity risk premium to improve overall funded status becomes a double-edged sword. As Edward Qian of PanAgora Asset Management (2012) observes, the equity risk premium is tied to growth risk in the economy and is correlated to corporate sector health. When equity risk causes a negative impact on funded status, it is likely that the plan sponsor is also experiencing deteriorating fundamentals, and the corporation’s ability to achieve its primary business objectives may be impaired by the potential that intervention is needed to bring funded status back in line. Qian suggests the use of risk parity (RP) strategies to diversify a pension plan’s economic risk exposures while maintaining the ability to take enough overall risk to improve funded-status outcomes. While we have previously explored the concept of the Diversification PremiumTM and the ability to increase Sharpe ratio via an RP approach, which can then be levered to match risk preferences resulting in a higher expected return, the application within a pension portfolio is even more intriguing. The Uncertainty Portfolio approach – for which we advocate from a total return perspective – is a great fit for funds with an absolute return target where Sharpe ratio maximization generally leads to the best outcomes for a fund’s growth sleeve. However, an even more interesting result is how the explicit balance between macroeconomic factors provides a natural match for the dominant risk factors within a pension’s liability portfolio. In an actuarial journal article from 2007, Meder and Staub decomposed the liability exposures of a model pension fund into macroeconomic factors, ultimately finding that predominant contributors to overall liability risk were wage growth, inflation, and interest rates. Intuitively, these factors make sense:
- Wage Growth: As wages rise, future liabilities will rise, as pension benefits are tied to wages near the end of employment.
- Inflation: As costs of goods increase, wages will rise as well.
- Interest Rates: Factoring directly into the discount rate, higher or lower interest rates will impact the future value of liabilities.
Each of these macroeconomic factors has a corresponding asset class (or combination of asset classes) that can best provide exposure to them, thereby providing protection against prevailing risks within the liability portfolio. In our view, using a combination of a cash-flow immunizing bond portfolio and an RP portfolio provides a more robust framework that is adaptive to changing risk dynamics, allowing pension funds to capture better funded-status outcomes.
To numerically investigate the benefit of utilizing an RP strategy within a pension plan, we use a block bootstrap resampling methodology, which proves as a way of simulating possible future asset class behaviours. [2] Our goal is to understand the simulated future paths of a pension plan growth portfolio, as compared to the liabilities of the pension. Here, we proxy the liabilities with a portfolio of fixed-income assets with an average duration of 10 years, evaluated over a 10-year time horizon, composed of a mix of intermediate- and long-term corporate and government debt instruments. [3] Furthermore, we track the monthly change in short-term (three-month) bond yields and the resampled data to capture the interest rate environment.
To generate simulated historical monthly return series, we resample U.S. equity, bond, and commodity markets dating back to 1977. [4] This gives rise to an ensemble of alternative historical paths for assets, all of which show a different evolution over time, and draw from multiple macroeconomic regimes, such as the significant rising rate environment in the 1980s. For each historical path, we investigate the performance – within the context of a pension plan – in both a static 60/40 (equity/bond, fixed capital allocation) portfolio, and an 8% volatility targeted RP portfolio. Specifically, we construct our RP portfolio allocations using a 12-month lookback on the assets to estimate an empirical covariance matrix, which is then used to infer which specific weights correspond to equal risk contribution of the assets within the portfolio. We then apply leverage to scale the resulting portfolio to a volatility of 8%, which was selected as the corresponding risk of a balanced 60/40 portfolio during ‘normal’ times. [5]
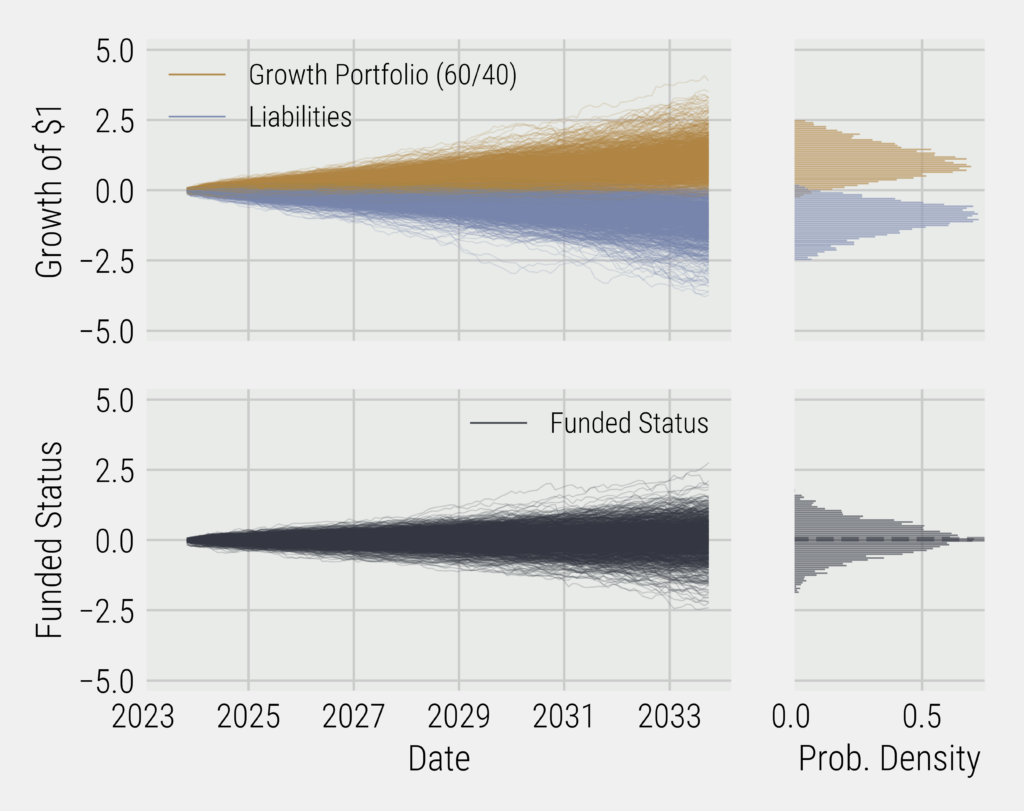
In evaluating the performance of each strategy within the context of a pension plan, we look at the funded status of the plan over time: the value of growth assets less the value of unhedged liabilities. For instance, the top left subplot of Figure 1 shows the evolution of resampled 60/40 portfolio trajectories in tandem with the growth of liabilities (in the negative direction) over the same time period, while the top right subplot shows the distributions of final values after a five-year period has elapsed. Alternatively, the bottom left subplot shows the evolution of the plan’s funded status over time (assuming an initial funded status of 100%), while the bottom right shows the distribution of final funded status over the distribution of plan trajectories.
Here, we can see that there is a significant variation in the final funded status of the pension plan, with the average (mean) value (103% funded, after 10 years) increasing relative to the initial state, but the probability of ending up at less than 100% funded after 10 years (shortfall probability) is also significant, coming in at ~47%.
Conversely, we can look at the same analysis, using the 8% volatility RP portfolio instead of the 60/40 growth portfolio. Figure 2 shows the comparable plot for an RP portfolio. Here, while the results look qualitatively similar, the quantitative aspects of the portfolios vary significantly. First, the RP portfolio in isolation has a higher aggregate and risk-adjusted return when compared to the equity-risk-concentrated 60/40 portfolio. Specifically, the RP portfolio ensemble boasts an average CAGR (of the trajectory ensemble) of 10% with an average volatility of 8.1%, while the static 60/40 portfolio showed an average return of 7.8% and an average volatility of 9.5%. For comparison, the average (median) funded status after a 10-year period using the RP portfolio for asset growth is 151% and shows a shortfall probability of only 22%. In addition to this, however, is the fact that the RP portfolio is much more significantly correlated to the liability portfolio, which means that growth is more robust to changes in the liability portfolio and the funded status should be more stable over time.
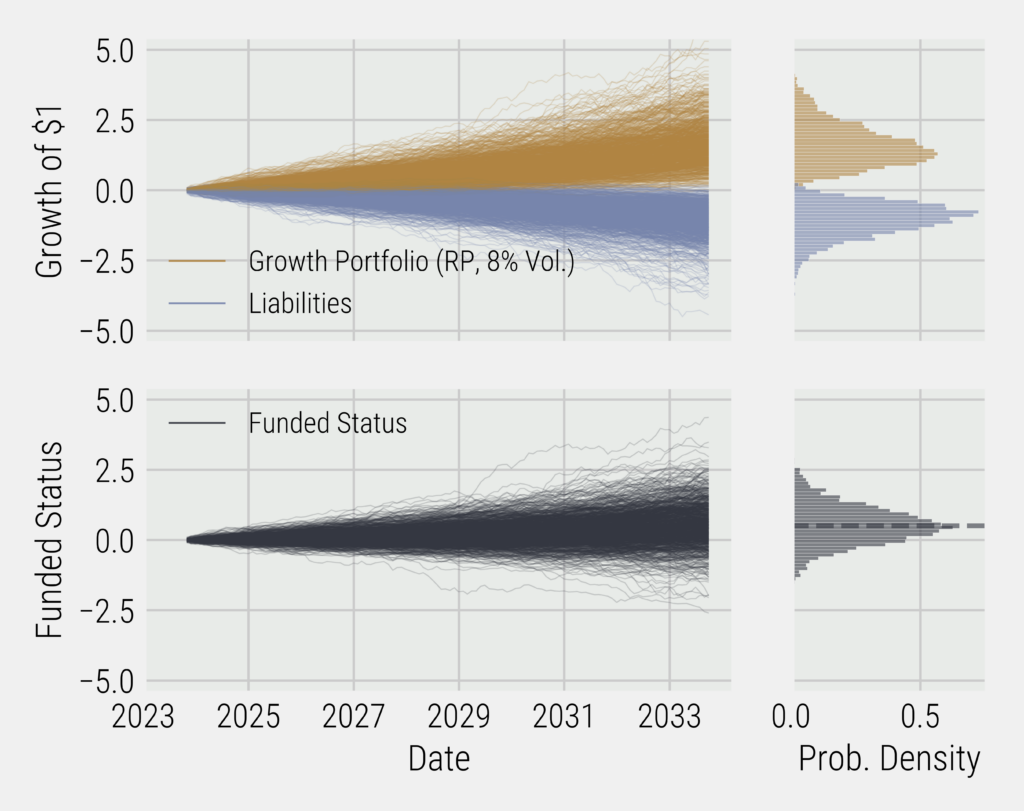
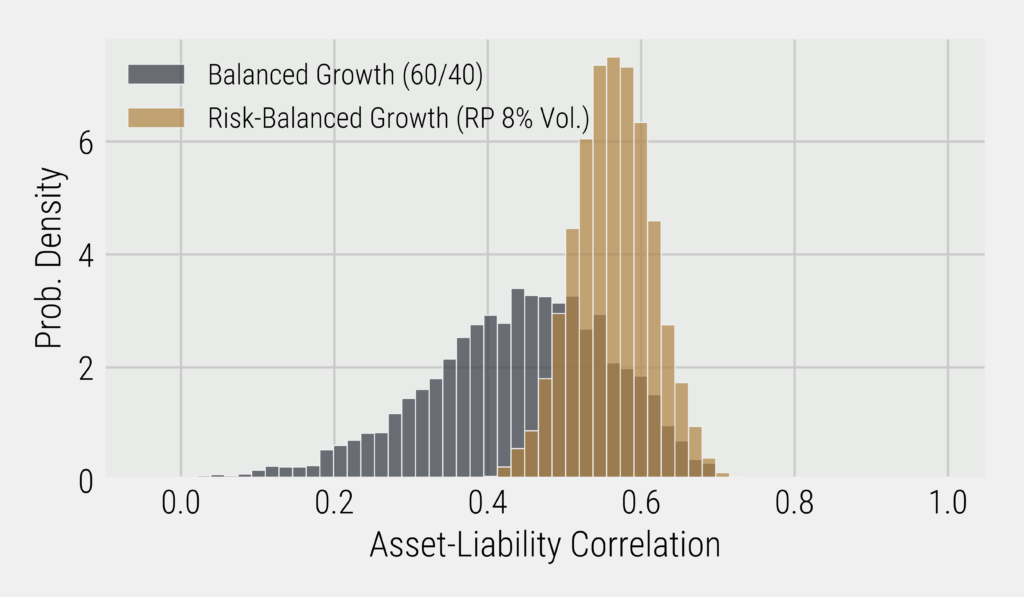
Figure 3 shows the ensemble of historical correlations between both the static 60/40 portfolio and the RP portfolio with respect to the liability portfolio. Here, we can see that there is a significant difference between the correlations to liabilities of the RP portfolio when compared to the balanced 60/40 portfolio, with the average (mean) correlation between RP and the liabilities being 0.56, while the mean correlation between the 60/40 portfolio and the liability portfolio is only 0.44. In this situation, a higher correlation is desired, as this implies that periods of poor performance in the growth portfolio softened by a higher likelihood of occurring during periods of poor growth in the liabilities portfolio (and vice versa). Furthermore, the long left tail in the 60/40 growth portfolio suggests that there can be a significant probability of asset-liability mismatch occurring, likely during market stress events.
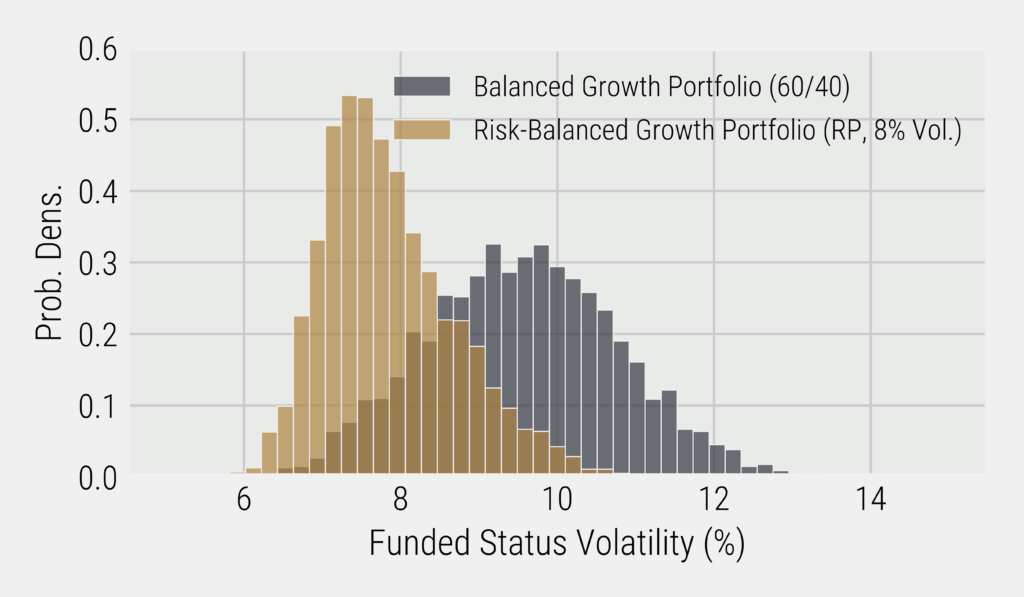
Pulling all of this together, we can look at the distribution of historical funded-status volatilities. This is the volatility of the historical funded status (growth portfolio less liabilities portfolio) in each resampled trajectory. Figure 4 shows the distribution of funded-status volatilities for the RP (gold) and 60/40 (black) allocation growth portfolios. Here, it’s clear that our prior claim is borne out: funded-status volatilities are expected to be lower when an RP approach is used in the pension plan’s growth sleeve, as opposed to when a static 60/40 allocation is used. Here, the resampled trajectory average (annual) volatility is 7.9%, compared to 9.6% in the static portfolio. This can then be compared to give a value for the surplus growth efficiency (funded-status growth rate divided by funded-status volatility) of 1.28 for the RP approach and 0.76 for the static portfolio allocation.
In what follows, we also look at how these two comparable approaches behave in scenarios where the plan is initially underfunded (growth assets less unhedged liabilities < 0). Importantly, in all of these scenarios, the results about funded-status volatility and distribution of correlations are unchanged.
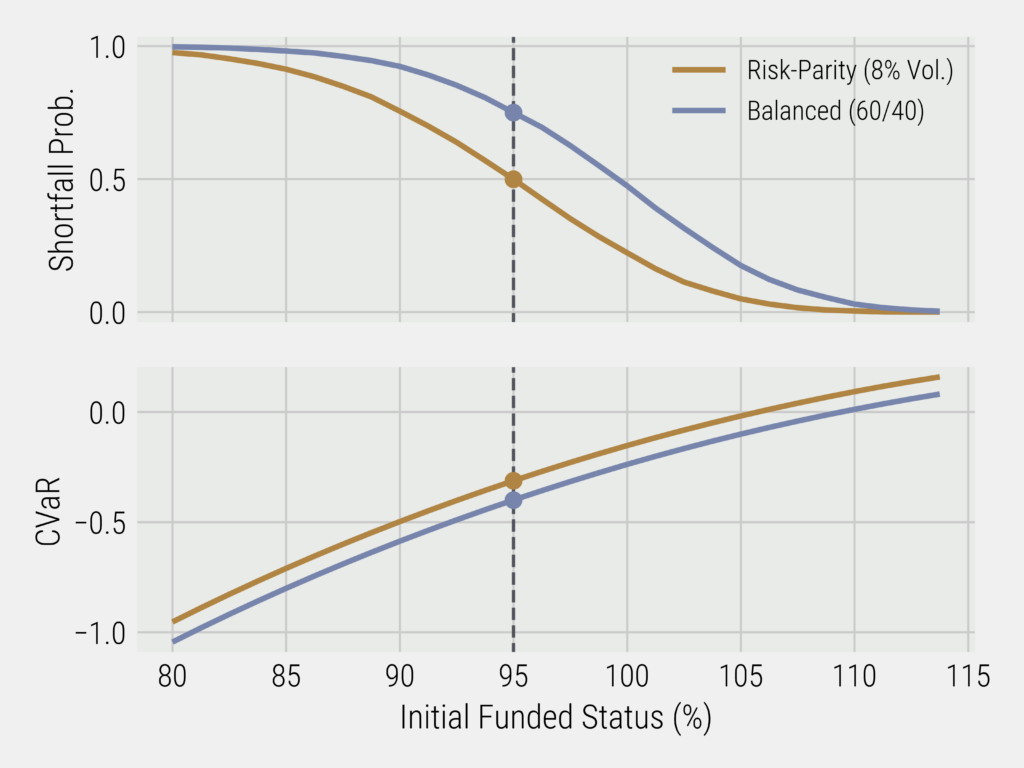
As a function of the initial funded status, we can look at two quantities of interest: shortfall probability and 5% Conditional Value-at-Risk (CVar) of the final funded status. [6]
In this analysis, we assume (for concreteness) that 80% of the portfolio value is put towards hedging liabilities using an immunization portfolio and the remaining 20% is put into a growth sleeve. As a result, under-funded plans have an excess of unhedged liabilities when compared to growth assets. Relative to pension plan value, a 90% funded plan has liabilities worth ~111% of the total value of pension assets. If 80% of the pension plan’s assets are put to work in an immunizing portfolio, that leaves 31% of the liabilities unhedged. To improve funded status, the 20% growth sleeve needs to increase in value relative to that 31% of unhedged liabilities. Figure 5 shows shortfall probability and CVaR as functions of the initial funded status for both the static 60/40 and RP portfolios. Here, we can see that the RP approach universally decreased shortfall probability, with the shortfall probability surpassing 50% at an initial funded status of 95%, while the 60/40 portfolio at the same mismatched initial funded status shows a shortfall probability of 74%. Furthermore, the RP portfolio also consistently reduced CVaR relative to the balanced portfolio.
A Portfolio for All Seasons
While we have found that there are structural advantages through the application of prudent, liquid leverage to a highly-diversified portfolio compared to taking similar levels of risk in a portfolio that is more concentrated, the benefits of this type of portfolio construction are much more meaningful when dealing with pension portfolios. This is particularly true when the risk factors that are being balanced via the diversified approach are done so to purposefully match the risk factors within the pension’s liability portfolio. The analysis in the previous section utilizes a very naïve RP portfolio; it has equal risk allocation between U.S. stocks, U.S. bonds, and a broad commodity index. To calculate the capital weights and leverage targets for the portfolio, a lookback window of one year is used, rebalanced monthly, and is therefore relatively slow to adjust. While this portfolio is still adaptive to changing market environments and is expected to capture a significant edge over typical portfolios, especially in the context of the asset-liability framework, we posit that a more thoughtfully crafted and purpose-built RP portfolio would deliver even stronger results. Either working with actuaries to capture the unique risk factors within a pension’s liability portfolio or utilizing a generalized framework like the one explored within the previously mentioned article by Meder and Staub (2007), a good RP manager can balance risks in a bespoke way to fit the pension fund’s needs. In most cases, this will take the form of a strategy that results in the highest expected growth per unit of funded-status volatility and is scaled appropriately based on the pension’s beginning funded status and risk tolerance.
We can understand the ability for our different growth sleeve options (RP and 60/40) to maintain or improve funded status during different macroeconomic environments by looking at how they have performed historically during regimes defined by growth and inflation. Figure 6 shows the average return of the balanced portfolio, the simple RP portfolio, and our proxy liability portfolio during each environment.
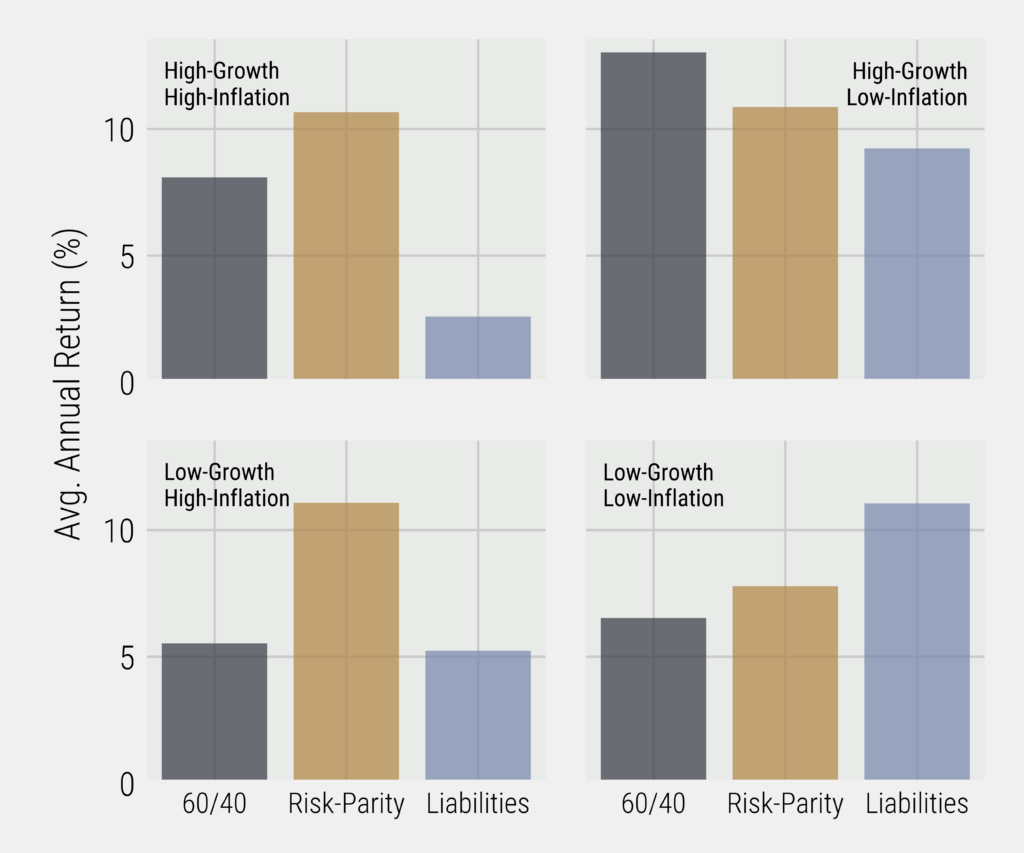
Here, we see that the RP portfolio outperforms the balanced portfolio in all environments with the exception of the high-growth, low-inflation environment and does a better job of keeping up with liabilities during the low-growth, low-inflation environment that is prevalent during recessions. This is to be expected, as the 60/40 portfolio is heavily dependent on equity performance, as evidenced by the 90%+ correlation between balanced funds and the equity market found by Man Institute (2023) in a recent article. This more robust performance profile explains much of what we found in our resampling analysis in the previous section with regard to RP being a superior option for pensions looking to improve funded status without taking on significant shortfall risk.
What’s Good for the Goose, Likely Works Just as Well for The Gander
While the findings of this research note support the conclusion that RP portfolios offer a more robust option for liquid assets within a growth sleeve in an LDI framework – which plan sponsors should be quite excited about – we also believe that these findings have important implications for individual investors. As alluded to earlier, pensions serve as a retirement savings vehicle for their beneficiaries. Many people don’t have such a plan or have an inadequate pension and thus must rely on investment portfolios to serve that purpose. It stands to reason that what is likely best for a collection of retirees in a pension fund may also be best for retirees that are required to utilize their personal savings for the same reason. Individuals may not go through the same rigour of creating a forecast of future cash needs from their portfolios and quantifying the underlying risk factors the same way, but for anyone who wishes to draw on their portfolio at some point in the future – even if that future is not within their lifetimes, but rather the lifetimes of their future generations – the same rules apply. Broadly speaking, as the cost of goods and services increases, the amount of money to finance future spending also increases. Therefore, inflation protection is important. As one’s wages increase, their lifestyle is also likely to become more costly in a phenomenon called ‘lifestyle creep.’ Therefore, hedging against wage growth is important. And, finally, due to the ability for investors to hedge away some of the risks associated with future spending, the risk-free rate of return is also important. If we peel back all of the layers, any one person can treat themselves as a plan sponsor who is funding their own pension portfolio. And, any wealth manager can and should look at their portfolio of client assets as a miniature pension fund. Individuals have even more concentration on timing risk of cash flows in that they will likely make the switch from contributing savings to a portfolio to drawing on a portfolio at one specific time, whereas a typical pension fund has more of a revolving door situation in which contributions and benefit payments are occurring throughout the life of the plan. This makes it even more important for individuals and those looking after assets on behalf of individuals to ensure the strategies they are utilizing are truly robust to different macroeconomic environments and are adaptive to changing market conditions.
If we take a step back, a risk allocation framework, like the naïve one we’ve explored together here, is not a silver bullet and we will never claim it to be one. However, when done thoughtfully, the framework takes a risk-centric approach to asset allocation and reduces unintended consequences that arise from concentration, allowing us to more directly meet investment objectives.
References
CCH HR (2009) Milliman Finds Record Losses In Pension Funded Status During 2008. Available at: http://hr.cch.com/news/pension/040709.asp.
Kaya, H., Cheng, T. and Xu, F. (2020) Risk Parity: A Flexible Tool for DB Pension Plans, Neuberger Berman. Available at: https://www.nb.com/en/ca/insights/risk-parity-a-flexible-tool-for-db-pension-plans.
Meder, A. and Staub, R. (2007) Linking Pension Liabilities to Assets. Available at: https://www.soa.org/globalassets/assets/library/journals/actuarial-practice-forum/2007/october/apf-2007-10-meder-staub.pdf.
Qian, E. (2012) ‘Pension liabilities and risk parity’, The Journal of Investing, 21(3), pp. 93–101. Available at: https://www.panagora.com/wp-content/uploads/JOI-Pension-Liabilities-and-Risk-Parity.pdf.
Zeid, T.A. and Hoyle, E. (2023) ‘Bonds: Shaken, but Not Stirred’, Man Institute, September. Available at: https://www.man.com/maninstitute/bonds-shaken-but-not-stirred?utm_source=savvyinvestor&utm_medium=media&utm_campaign=savvy-content&utm_content=textlink.
Footnotes
[1] ‘Defined Benefit’ plans are those where the plan sponsor guarantees a specific periodic payout to beneficiaries based on a calculation, which is often related to each beneficiary’s earnings, tenure, and age. A ‘Defined Contribution’ plan, on the other hand, only guarantees that an employer or plan sponsor and the beneficiary (in most cases) contribute a certain amount periodically to the pension plan. In a Defined Contribution plan, the benefit received is contingent on the performance of the asset portfolio.
[2] Specifically, ‘Block Bootstrapping’ randomly resamples chunks of data from the historical record and stitches them together in different permutations. As a result, the simulation methodology can generate a representative return series, while also preserving inter-asset correlations. In contrast to other simulation methods (e.g., simulated Geometric Brownian Motion) where growth rates, volatilities, and correlations are often fixed through time, resampling has the potential to capture more nuanced market-characteristic dynamics through various macroeconomic regimes by preserving contemporaneous events across asset classes.
[3] Our methodology here is similar to related work by Kaya, Cheng, & Xu (2020), where the authors proxy a liability portfolio with a fixed-duration bond portfolio. Here, for completeness, we use a contiguous opportunity set and backfill any missing data on duration with the first available data point.
[4] Proxied by the SPX (equity), LUATTRUU (fixed-income), and (BCOMTR) commodities indices.
[5] Here, we find the ‘normal’ volatility of a balanced 60/40 portfolio by taking the median value of all historical three-year rolling volatility estimates. Intuitively, this is the nominal risk level that an investor seeking exposure to a balanced portfolio is willing to take and thus serves as a rational target for the risk level of our RP portfolio.
[6] CVaR represents the expected shortfall of a quantity, given that it is in the worst X% of potential outcomes. Here, we investigate the 5% CVaR of the funded-status distribution, which quantifies the expected funded-status level, given that we are in the worst 5% of outcomes.
ABOUT THE AUTHORS


DISCLAIMER:
This blog and its contents are for informational purposes only. Information relating to investment approaches or individual investments should not be construed as advice or endorsement. Any views expressed in this blog were prepared based upon the information available at the time and are subject to change. All information is subject to possible correction. In no event shall Viewpoint Investment Partners Corporation be liable for any damages arising out of, or in any way connected with, the use or inability to use this blog appropriately.