
Research Notes
These Stupid Things Called Brains
I recently attended the Calgary CFA Society’s Annual Forecast Dinner. It’s probably the only event of the year where the entirety of the city’s investment and finance professionals come out of their dens for some awkward hobnobbing. The event, of course, is centered around forecasting. It’s a magical place where John Smith, CFA shuffles reluctantly to the stage from the back of the room for throwing a dart that correctly predicted where the S&P 500 would end 2019. He receives a $1,000 cheque. It’s a place where most people in the room laugh off the idea that anyone can predict anything in financial markets and then groggily return to their offices the very next morning to do just that. It’s a room full of exceptionally smart people doing basic math on their iPhone calculators, because they’re useless without Excel.
It was a fantastic event this year. My friend Marty Pelletier did a great job of putting together a line-up of speakers who are more popular on Twitter than on CNBC, yet they have a better finger on the market pulse than any chief economist. The night had great flow, with plenty of time to chat around the table without feeling rushed. And, perhaps most importantly, it ended in time to grab a few cocktails at the hotel bar. It was actually the best Forecast Dinner that I’d ever been to.
One of the speakers put forth a narrative that central bank manipulation has destroyed the ability of professional stock pickers to beat market indexes. “Quality,” a factor that most stock pickers look for when buying public businesses, has not been rewarded because the excess liquidity in the system injected by the Federal Reserve has bid up crappy companies as much as quality companies. What is “quality” you might ask? To quote Norges Bank Investment Management’s excellent summary paper on the quality factor:
Quality as an equity investing style refers to the idea that companies that are highly profitable, operationally efficient, safe, stable and well-governed tend to outperform the market average over the long run. Quality-based investment strategies can be defined in a variety of ways. Some relate quality to gross profitability (Novy-Marx 2013); some define it as return on invested capital (Greenblatt 2010); and others prefer to use a combination of various profitability, earnings quality and leverage metrics (Grantham 2004).
Researchers can create models that buy “quality” companies, based on a set of pre-defined rules around certain financial metrics over time. The results are tested based on historical data.
Let’s take a look at the data that was originally presented:
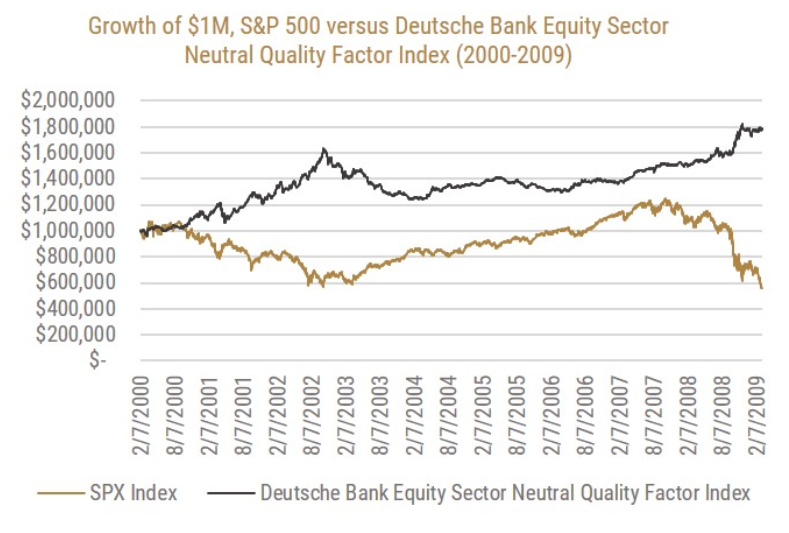
The gold line is the performance of the S&P 500 over the time period from 2000 to the financial crisis in 2009 – this is market beta. The black line, on the other hand, is the performance of a long/short quality index on U.S. stocks. The index goes long a set of high-quality stocks based on a set of rules, and it shorts the low-quality stocks. This is alpha, because it’s market neutral.
So, the long/short quality index in question worked well over this period.
The next chart shows the same data, but from the financial crisis onward:
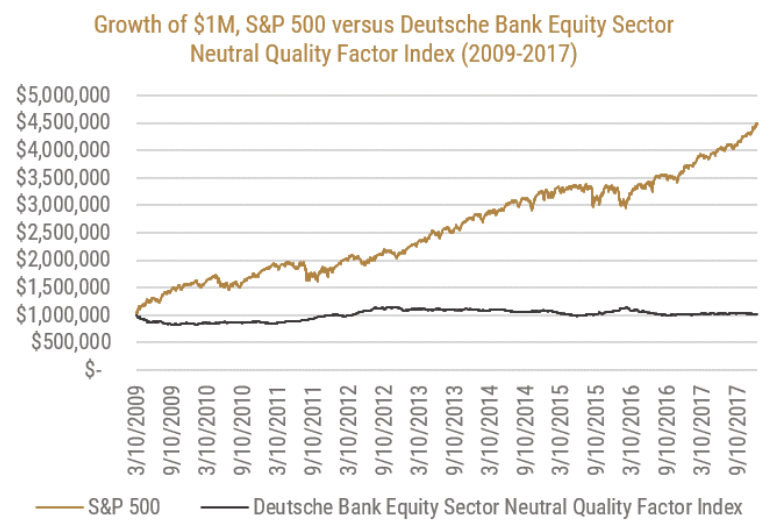
This paints a striking picture – the S&P 500 (beta) is up 300% over the period, while the quality index (alpha) is up only 3%. So, quality worked well from 2000 to 2009, but then didn’t work at all from 2009 to 2017. The easy conclusion is that this is a result of central bank liquidity driving up all companies equally – both the quality company and the crappy companies – and investors weren’t rewarded for quality.
This makes sense anecdotally.
But the problem is that this narrative seems too clean. So, we started to do some digging.
Our first finding was that the methodology of the selected long/short index in question, the Deutsche Bank Equity Sector Neutral Quality Factor Index-USD-Excess Return, is a global index (MSCI World Equal Weight – USD Index). It includes companies from all over the world, around 40% of which are based in the U.S. This index was being charted against the cap-weighted U.S. stock market (coincidentally the best market in the world over this period) and this is a misleading comparison. It’s comparing beta to alpha.
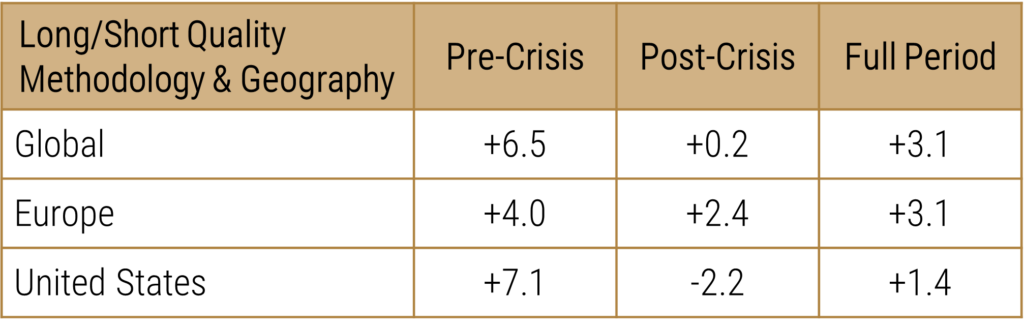
Secondly, this index is only looking at one methodology. There are a few different indices that have a long/short quality methodology in addition to the Deutsche Bank index that was selected. The first thing we always do is the highly evidence-based and complex method of sitting down on the Bloomberg terminal and typing in the first thing that comes to mind. In this case, we wanted to see all the available long/short quality indices (of which we were certain there would be very few), and we found two more, albeit on different markets:
Looking at the pre-financial crisis period, we can see that all three worked incredibly well. Post-crisis is a much more mixed bag, with one index flat, one down, and one up. Remember, this is alpha. All three indices are long high-quality companies, based on how the respective index defines them, and short low-quality companies.
These indices are tracking different geographical markets, so they are not directly comparable. But at least they are both isolating and comparing alpha and quality.
As mentioned initially, there are many different methodologies and philosophies of what the actual “quality” factor is composed of. The original research from Fama and French is the bedrock of the factor, but there are many iterations and improvements that have been made from that original research.
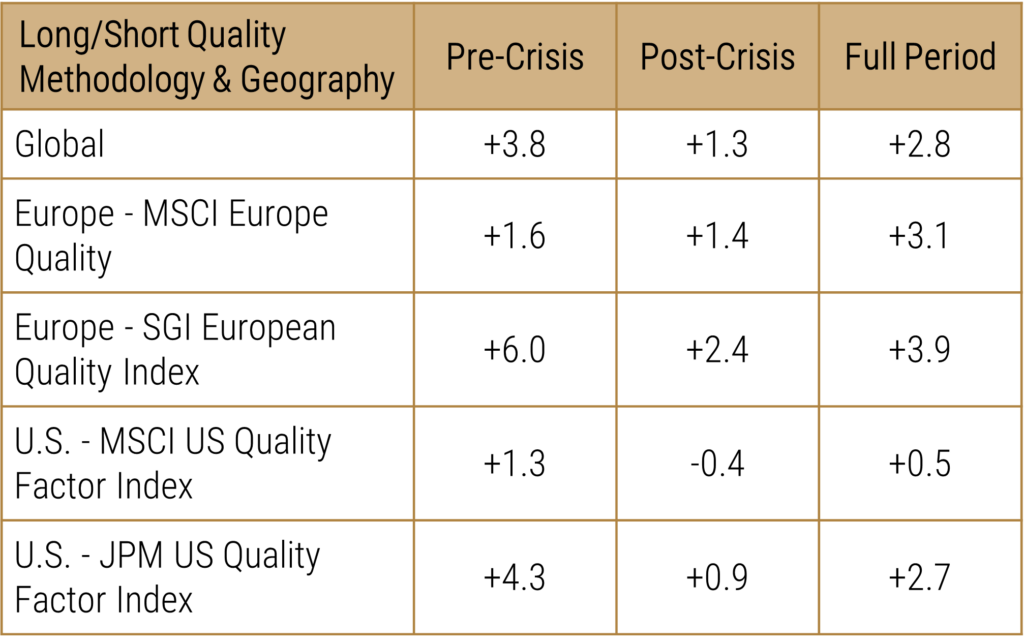
For example, in the three long/short quality indices, here is how they are each running their screens:
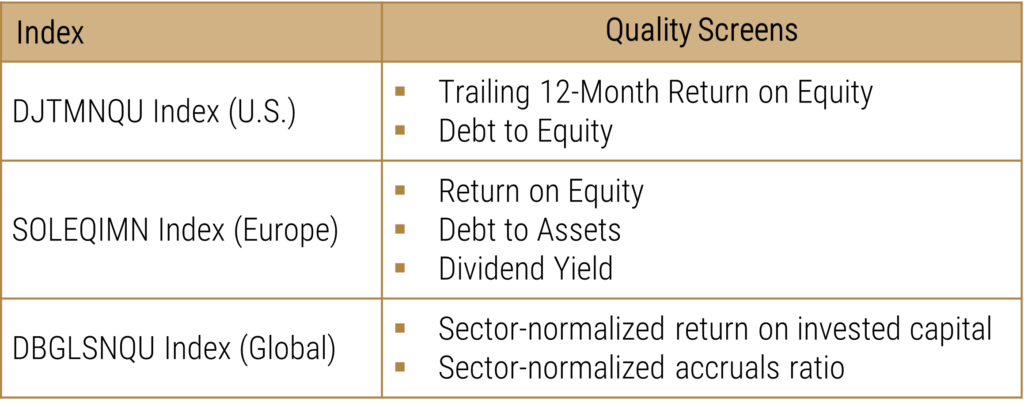
These different methodologies of quality produce significantly different results.
Given the limited availability of investable and liquid indices that use a long/short quality methodology, we want to also look at long-only quality. We also tend to think that this is more relevant for the vast majority of both professional and retail investors.
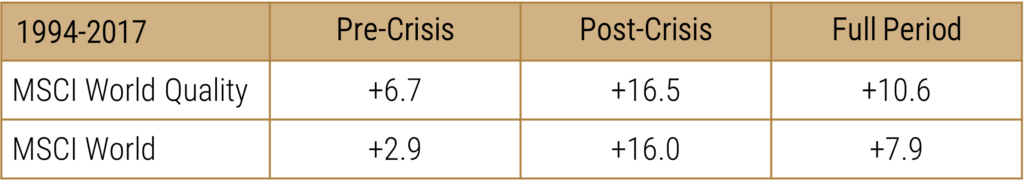
The MSCI World Index is a popular cap-weighted benchmark for global stock markets; this would support the original hypothesis.
However, since the original hypothesis was published on December 21st, 2017 to the end of 2019, here’s how quality performed:
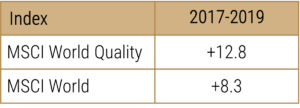
This paid off in spades in 2019.
From looking at this indicator of long-only quality on global stocks, we can say that it seems to have worked in all three scenarios to varying degrees, and in particular the most recent period of 2017 to 2019.
Let’s break it down into geographies for more depth:
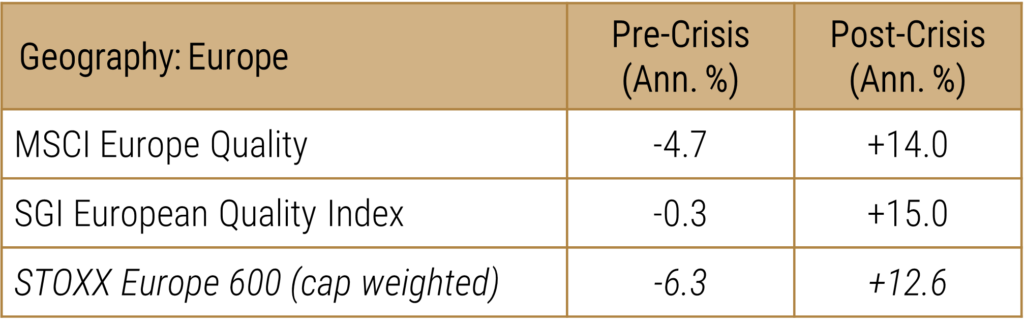
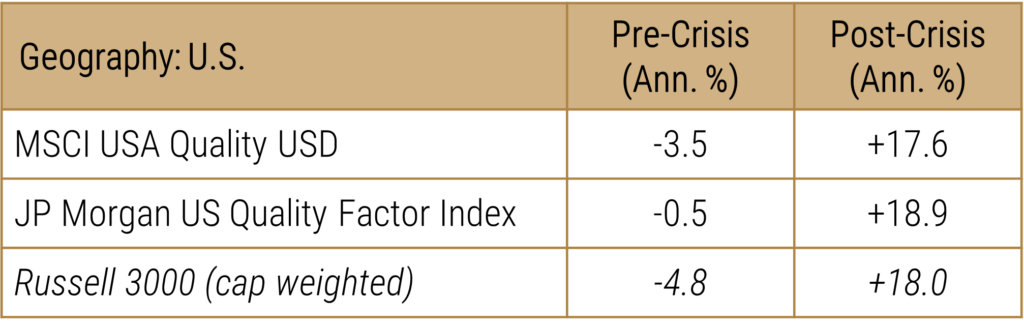
Using a long-only methodology, the quality factor in Europe was successful both pre- and post-financial crisis, while the U.S. is mixed.
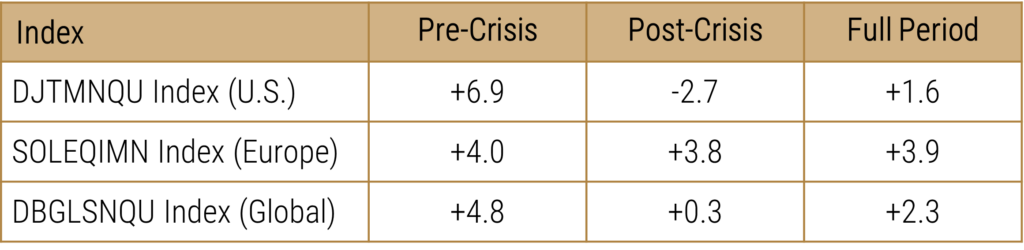
Let’s summarize the results of our analysis, using multiple different methodologies and indices to evaluate the performance of the quality factor pre- and post-GFC:
Amount of % of Outperformance (+) or Underperformance (-) of Quality Factor
Using a variety of methodologies, geographies, and sources, we find support for the hypothesis that quality worked better before the Global Financial Crisis than it did post-crisis – but only moderately so. It’s hardly enough of a justification to declare that quality is dead.
It is important to note that we can find signals to justify any narrative. Confirmation bias is most likely responsible for losing more investor money than actual bear markets. We could present the opposite conclusion from the original analysis – that quality has worked exceptionally well over the past 30 years – with a few periods and a few geographies to the contrary. We would hypothesize that a better theory might be that quality doesn’t work as well in big bull markets during expansionary periods, when high-growth companies look attractive, and works well to limit downside risk in bear markets.
To borrow from Farnam Street:
Confirmation bias is our tendency to cherry-pick information that confirms our existing beliefs or ideas. Confirmation bias explains why two people with opposing views on a topic can see the same evidence and come away feeling validated by it. This cognitive bias is most pronounced in the case of ingrained, ideological, or emotionally charged views. Failing to interpret information in an unbiased way can lead to serious misjudgments. By understanding this, we can learn to identify it in ourselves and others. We can be cautious of data that seems to immediately support our views.
The acknowledgment of errors in logic can be awkward and unpleasant for individuals, which makes it extremely difficult to seek information that is at odds with your deeply ingrained beliefs. The challenge with this type of cognitive error is that it reinforces a narrative that can lead to sub-optimal decision making. The human brain is wired in such a way that individuals process information more efficiently when it is weaved into a narrative versus being relayed via individual data points which provide no context. Unfortunately, when it comes to decision making, narratives that invoke a “call to action” are more likely to resonate with individuals, because it triggers an evolutionary “fight or flight” response that is much easier to act on. It becomes much easier to “fight” a negative narrative by acting in some way, as opposed to processing a positive narrative where the optimistic view is to not do or make any changes. For investors, this often results in either excessive trading patterns from reactions to nothing more than the noise of financial markets, or lost opportunity costs from withdrawing from financial markets to guard against the potential for some sort of calamitous collapse in the financial system.
As anyone who follows our work at Viewpoint will know, we work exclusively with data to build algorithms. We’re making tactical and strategic decisions with our and our investors’ capital based purely on data. And this is probably the most important topic that we discuss and debate on an ongoing basis – what are our inherent biases and how does the data we’re using play to them? How and why does this algorithm work? What are we missing? Have we looked at all possible data sources, or did we just choose the first one that worked? Is it even working or are we just perceiving that it’s working?
One thing that I’m sure of is that human bias and the effect on behaviour will never go away, because we’ll always be stuck with these incredibly sophisticated and incredibly stupid things called brains.
ABOUT THE AUTHOR

DISCLAIMER:
This blog and its contents are for informational purposes only. Information relating to investment approaches or individual investments should not be construed as advice or endorsement. Any views expressed in this blog were prepared based upon the information available at the time and are subject to change. All information is subject to possible correction. In no event shall Viewpoint Investment Partners Corporation be liable for any damages arising out of, or in any way connected with, the use or inability to use this blog appropriately.