
Research Notes
Plot Twist: Your Bond Portfolio May Be Riskier Than You Think
Geek Level:
Read Time:

The Speed Read:
- Bonds are traditionally thought of as risk-free or safe-haven assets.
- However, fixed income investments have unique risks relating to their sensitivity to interest rate fluctuations.
- Sensitivity to interest rates movements means that bonds are not risk-free, especially if not held until maturity.
- Modified duration measures the sensitivity of individual bonds to parallel shifts that occur uniformly across the curve.
- While this “shift” risk is the most impactful driver of bond returns, “twists” in the curve also have a significant impact.
- Ignoring diversification of interest rate risk at different points on the curve can result in unwanted concentration and uncompensated risk factors.
- Before deciding on the total amount of interest rate sensitivity desired in a portfolio, the first order of business should be to reduce uncompensated risks through diversification.
Government bonds are often referred to as risk-free or safe-haven assets, and, in the right context, this is a correct label as they are low volatility investments that represent money lent to a sovereign nation with almost no risk of default. However, in the first half of 2022, a diversified portfolio of global government bonds returned -13.3% in CAD terms. So, how do we reconcile an outcome like this with the near-risk-free or safe-haven aspect of the asset class? In short, fixed income securities are being repriced daily, just like any other asset, and as with all other asset classes (stocks, real estate, commodities, etc.) there is risk involved in the buying and selling of government bonds. The main difference is that the cash flows on these investments are known ahead of time (ignoring varieties that include floating rates or embedded options), hence the “fixed” in fixed income. As an example, an investor that buys a 10-year government bond with a yield to maturity of 2% will earn an annualized 2% return if they hold that bond until maturity as long as the issuing entity doesn’t default on its debt repayment. However, if the bond is sold before maturity, the investor’s return is subject to fluctuations in the market price of that bond between the time of purchase and the time it is sold.
Using this concept, we can start to dive into what drives the price of a fixed income security. In this note, we will focus on government bonds, and we assume that default isn’t a material risk factor and ignore it for the sake of simplicity. A fundamental principle of bond prices is that they have an inverse relationship with the market yield. When market interest rates rise prices of fixed-rate bonds fall, and when interest rates fall prices of these bonds rise. How sensitive the bond’s price is to the change in yield is called its modified duration which describes the % change in the price of a bond for a 1% change in its yield. It is closely related to the concept of MacAulay Duration, which is the weighted average payback period on a bond. Further reading on this topic can be found here, but, put simply, bonds with a longer time to maturity and lower coupon rates have a higher sensitivity to changing interest rates. For example, a bond with 10 years to maturity and a 10% coupon has large cash flows throughout its life; returning 10% of the principal to an investor every year. This bond would have a modified duration of 2.3. Whereas a 10-year zero-coupon bond, which has a single cash flow at the end of its life when it pays the face value of the bond to the holder, has a duration of exactly 10. If the yield on each of these bonds was to increase by 1% the coupon bond would only lose 2.3% of its value, whereas the zero-coupon bond would lose 10%. Similarly, a 5-year zero-coupon bond has half the interest rate sensitivity of a 10-year zero coupon bond, and, as a result, its price would only fall 5% if rates rose by 1%.
Understanding duration is an important piece of quantifying the risk in a fixed income portfolio. When a coupon bond is issued, the issuing entity typically sets the coupon somewhere near the market yield and so a 10-year US government bond purchased in the early 80s would have given investors a different risk profile than a 10-year US government bond purchased today as interest rate levels are much lower than they were in the early 80s. Not only is the risk profile much different, but the expected return on these two bonds would have been quite different as well. In the absence of any view on future interest rates, and thus bond prices, the return an investor should expect on a fixed income security is equal to its yield to maturity. From an investment perspective, this can result in a paradoxical situation where falling yields, and therefore coupon payments, on newly issued bonds results in rising interest rate risk for bonds with a specific maturity as the duration of these newly issue bonds will be higher. Furthermore, while interest rate risk (duration) is rising, expected returns (yields) are falling. The figure below illustrates how the duration for the on-the-run 10-year bond changes as a function of yields over time, making the risk/return trade-off far less attractive now than it was in the 80s, for example. Of course, these two environments can’t be directly compared for many reasons, the most obvious being the persistent inflationary environment prevalent 4 decades ago, but it still highlights the fact that a naïve allocation to the 10-year US government bond, may not be suitable for all investors. This concept is explored further in this short article.
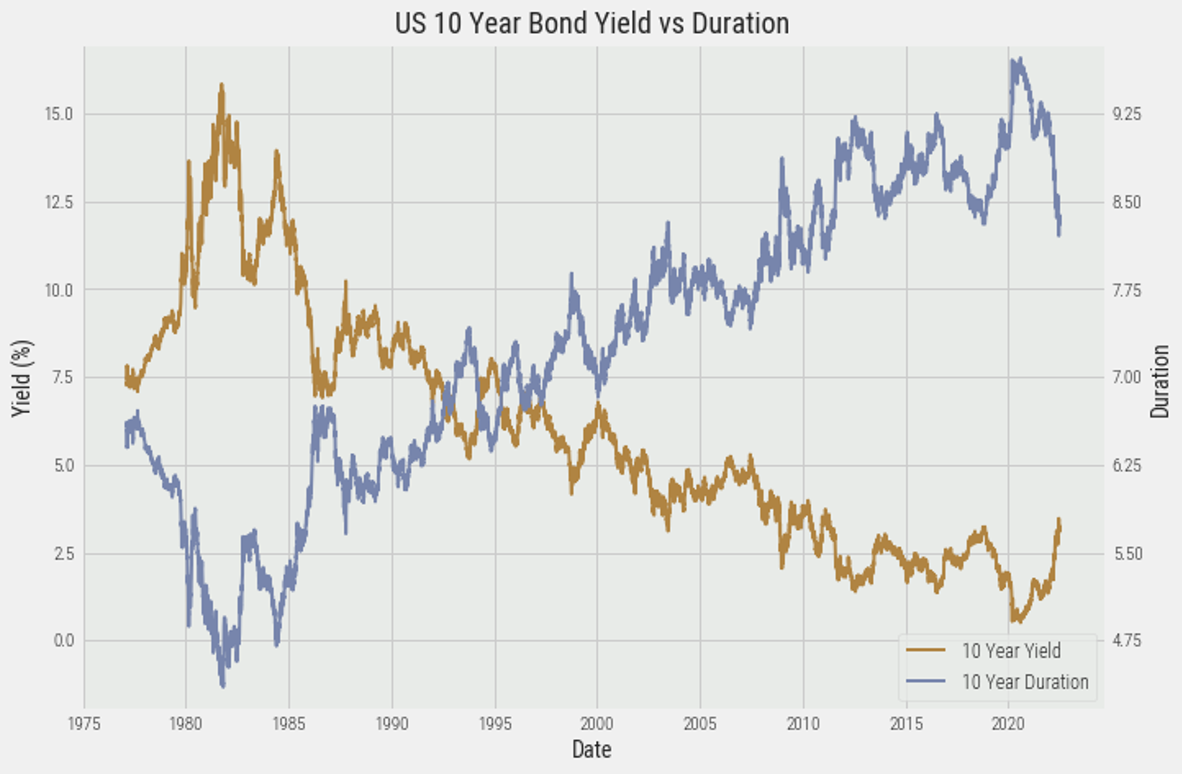
Source: Bloomberg, VIP Internal
In practice, investors can adjust duration based on the level of interest rate risk they desire, or are willing to take in their portfolios, and this decision can be based on a multitude of factors which we will cover in a future note. At Viewpoint, we build investment strategies based on risk allocation and strive to be intentional about risk exposure within portfolios. Consequently, the first order of business is to gain a deep understanding of what diversifiable (uncompensated) risks exist within our asset allocation. We take the approach that the foundation of any portfolio should eliminate all sources of diversifiable risk, and only start to layer on active overlays when we have an informational edge or desire a specific exposure (e.g., an amount of interest rate risk.) The issue is that modified duration, in the way we’ve discussed it so far, only describes how bonds react to a parallel shift in the yield curve, meaning that the measure is only exact when bonds of all maturities rise or fall by the same amount. In practice, a symmetrical shift doesn’t often occur, and yields across the curve tend to change by different amounts. We define this as a twist of the yield curve. In general, twists and shifts occur simultaneously to varying degrees, and the figures below illustrate that modified duration is only one of the risk measures that needs to be considered when building a bond portfolio. The left pane of the figure below shows a change in the US Treasuries Yield Curve that is more shift dominant. Here we see that the 5-year, 10-year, and 30-year bond yields all rise by approximately 1% from September 2012 to September 2013. This means that modified duration alone would have been quite accurate in describing the difference in returns that were realized by investors in these bonds. In contrast, the right pane of the figure below shows a change in the same curve during a period that is more twist dominant. Here the 30-year and 10-year bonds drop by similar amounts, while the 5-year bond realizes an almost negligible drop and the 2-year yield actually increases. This means that holders of short-term bonds would have experienced negative returns, while holders of longer dated bonds would have captured positive returns.
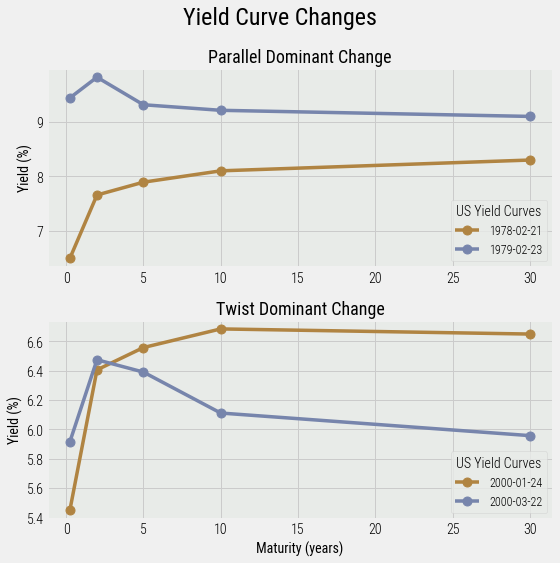
Source: Bloomberg, VIP Internal
Twists in the yield curve are often ignored by investors when deciding on the risk exposure of a bond portfolio as they are harder to quantify than modified duration. We can use principal component analysis (PCA), as detailed in this paper, to show that while the amount of variation in bond yields is dominated by parallel shifts, the remaining variation can be explained by twists (changes in yield curve slope and convexity) and is not inconsequential. The figure below shows the proportion of variance in bond returns that can be explained by shifts in the curve (gold line) and the variance that can be explained by twists in the curve (blue line).
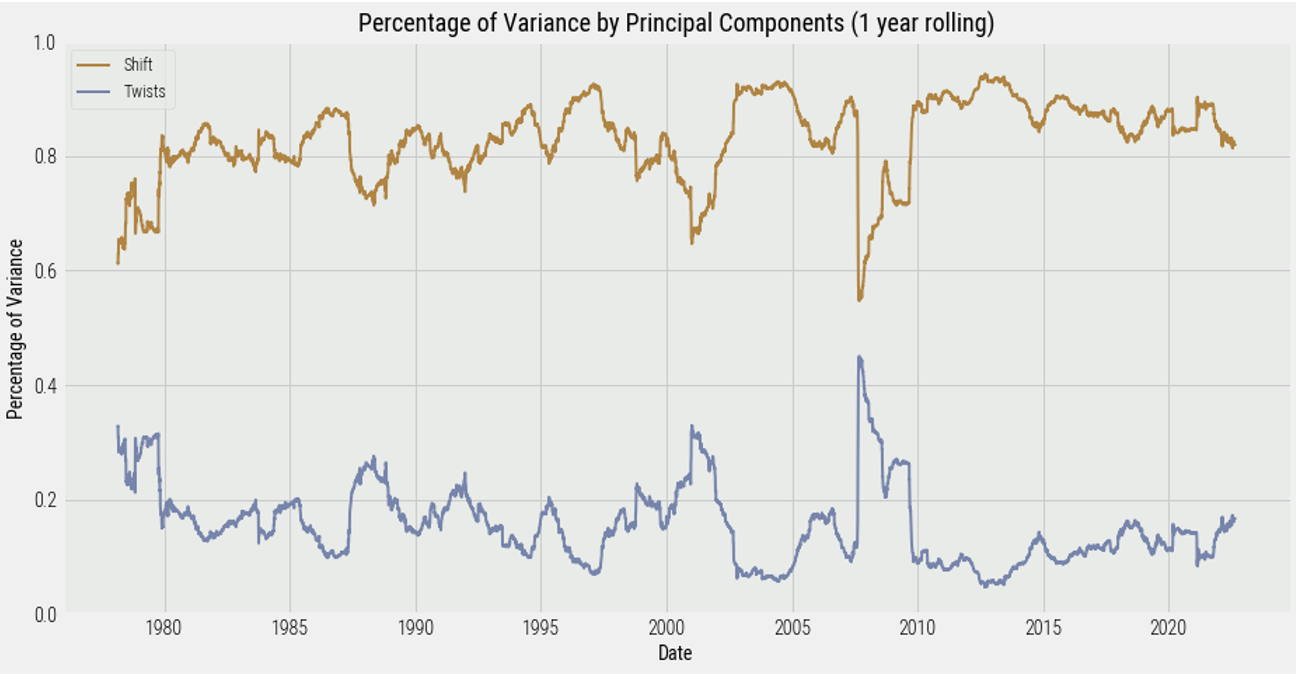
Source: Bloomberg, VIP Internal
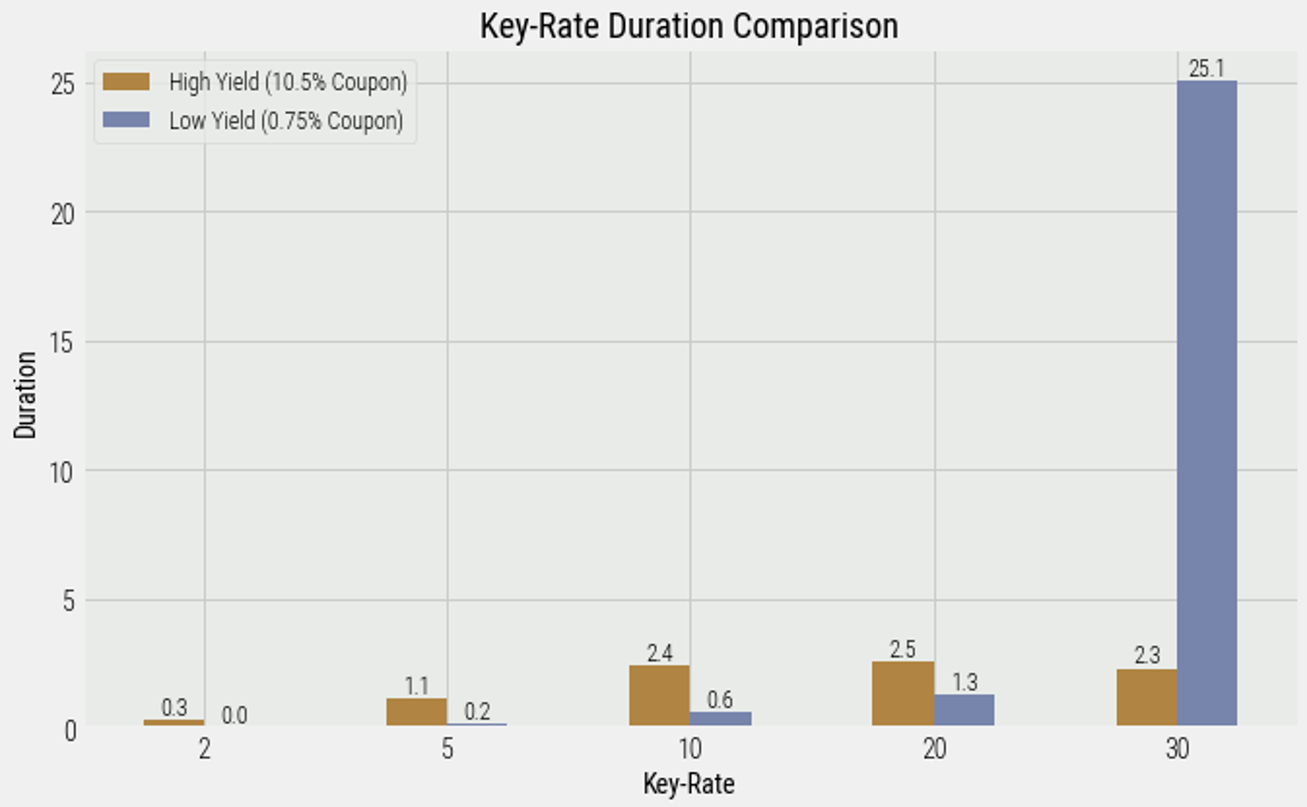
As we will illustrate throughout this series of research notes, using purposeful design to diversify the risk posed by twists in the yield curve results in a more robust and resilient bond portfolio over the long run. The simplest way to diversify this risk factor would be to hold a bond ladder consisting of different bond maturities. However, we still need to determine how much weight to allocate to each maturity to successfully remove as much uncompensated risk as possible from the portfolio. To help us determine the weighting for the bond ladder, we employ a measure called key-rate duration. Key-rate duration is very similar to modified duration, but where modified duration looks at a change of 1% at all points in the yield curve simultaneously, key-rate duration measures a bond’s sensitivity to a 1% change at each specific point (key rate) in the yield curve while keeping the other points constant. For bonds with interim cash flows (coupon bonds), yields changing at points on the curve prior to maturity will have an impact on the price of the bond. The larger these cash flows, the larger the impact on the bond’s price. The chart below compares the key-rate durations of two 30-year Canadian bonds, one which had a particularly high yield and coupon and another which had a particularly low yield and coupon.
Source: Bloomberg, VIP Internal
Even though these bonds both have 30 years until their final payment of principal, their sensitivity to changes along the yield curve varies. Remember that at maturity a bond returns the face value back to the holder of the bond, therefore this cash flow will be much larger than any prior coupon payment. If we focus on the 30-year key rates for these two bonds, we see a drastic difference of 25.1 for the 0.75% coupon bond and 2.3 for the 10.5% coupon bond. What we are seeing is that for the low coupon bond most of the future cash flow is dominated by this final payment and if the 30-year interest rate changes we have a lot of risk. This isn’t true for the high coupon bond as its cash flows are more evenly distributed throughout it’s life, returning 10.5% of the face value each year, so the sensitivity of changes in the final payment is much less. If we look at the 10-year key rate for these two bonds, we see the situation has flipped and the high coupon bond is more sensitive to changes in this key rate than the low coupon bond with durations of 2.4 and 0.6 respectively. Again, if we think about the cash flows this makes sense as we know the high coupon bond will have a lot more cash flow in it’s first 10 years than the low yield bond. This example shows that if we hold a concentrated portfolio we can end up in the undesirable situation where we have tremendous key-rate duration risk; diversification in our bond ladder can mitigate this risk. These insights can be used to quantitatively and rigorously define an optimal means of diversifying the key-rate risk along the yield curve and mitigate twist related risk as much as possible.
In this research note, we have explored the risks that come with investing in fixed income. We have established how modified duration works and highlighted some factors that drive the sensitivity of fixed income securities to interest rates. Additionally, we dug into the different ways that yield curves can move and impact the prices of bonds. We showed that it is not only parallel shifts in the curve that investors should concern themselves with, but also twists, where the movement of different points on the yield curve are less correlated, or move in different directions. Because the decision of how much interest rate risk an investor is willing to tolerate in their portfolio is a strategic or tactical decision, we focused on the need to diversify away uncompensated risk factors that come with concentration at specific points along the curve. Diversification along the yield curve is the foundational layer of the portfolio before making more impactful decisions like the optimal amount of duration risk for a portfolio. In the next research note in this series, we will explore the concept of key-rate duration risk further and introduce a multi-objective optimization framework in which we can find the weights of a portfolio that maximally diversify key-rate risk for a given modified duration target. Additionally, we will introduce a more novel quantification of risk on individual bond maturities, which utilizes the volatilities of underlying bond yields as well as their correlations to one another. This methodology draws inspiration from the risk parity engine powering the Viewpoint strategies to create a robust framework for fixed income investing. We then combine these two approaches to create a risk-based bond ladder construction methodology which helps us take the first leap in building a better bond portfolio.
ABOUT THE AUTHORS


DISCLAIMER:
This blog and its contents are for informational purposes only. Information relating to investment approaches or individual investments should not be construed as advice or endorsement. Any views expressed in this blog were prepared based upon the information available at the time and are subject to change. All information is subject to possible correction. In no event shall Viewpoint Investment Partners Corporation be liable for any damages arising out of, or in any way connected with, the use or inability to use this blog appropriately.