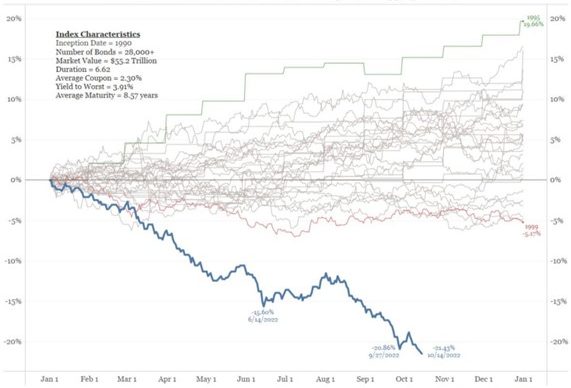
As we reflect on 2022, most investors will agree that it was challenging year. However, we can also take a prospective view that the challenges of 2022 have provided a much healthier opportunity set for investors looking into 2023 and beyond. For equity investors, depending on the strategy, most diversified indices saw losses that clustered in the 12-15% range in 2022. Growth and technology investors would have seen a more challenging year, while value and commodity-equity investors would have seen better results. This type of equity drawdown is understood and expected by most equity investors. In fact, U.S. equity investors have seen drawdowns of 10% or more 13 years in the past 95 years, for an occurrence level of about one in seven years. This may come as cold comfort to equity investors in 2022, but most investors understand the potential for equity drawdowns like this. The investors that were most heavily impacted in 2022 – at least relatively – were those that followed a more diversified approach to markets and had significant exposure to fixed income securities. Bond investors have seen unprecedented losses in 2022 and are likely questioning the long-term “safety” of bonds and their place in a diversified portfolio. As an indicator of the pain that 2022 inflicted on bond investors, the Bloomberg Aggregate Bond lost -13.7% on a year-to-date basis to December 16th, 2022. For comparison, there have only been two other years in the last 95 years where bond investors lost more than 3%. In 1969, bond investors lost -4.4% and in 1931, they lost -5.2%. So, for context, 2022 was almost three times worse than the average loss of the previous worst two years since 1928. As most investors realize, a loss like this in bonds is exceptionally challenging for those that were relying on this “safety net” asset, like retirees who were directed to be overweight this asset class and have lower wherewithal to absorb this loss.
FIGURE 1: Year-to-Date Total Return for the Bloomberg Global Aggregate Index

Source: Bloomberg; Bianco Research
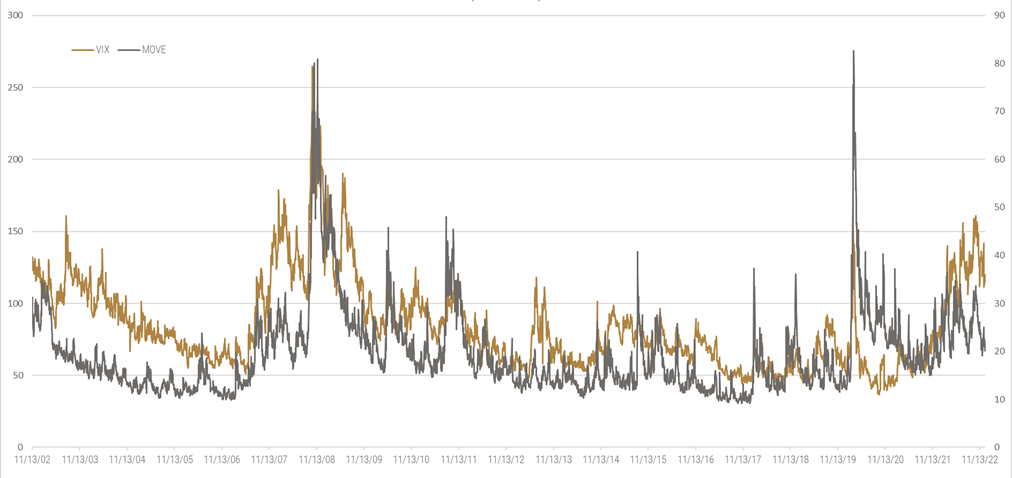
Another interesting perspective on 2022 fixed income returns is the volatility of interest rates – and hence fixed income returns – as measured by the ICE Bank of America Merrill Lynch MOVE Index. This index spiked to levels not seen since 2022 (briefly) and 2008 during the Great Financial Crisis. Although equity volatility, as measured by the CBOE Volatility Index (VIX), also elevated in 2022, the level and persistence of the rise was much lower than the MOVE index. For instance, as of December 16th, 2022, the VIX index had moderated to relatively normal 20.1 versus its long-term average of 19.5. For comparison, the MOVE Index remained at 115.0, one full standard deviation above its long-term mean of 84.6. Volatility in the bond market remains elevated against longer-term trends. This elevation remains persistent, because the realized volatility of interest rates has remained relatively higher than the realized volatility of stocks.
FIGURE 2: Comparison of U.S. Equity (VIX) and U.S. Interest Rate (MOVE) Volatility (2002-2022)

Source: Bloomberg
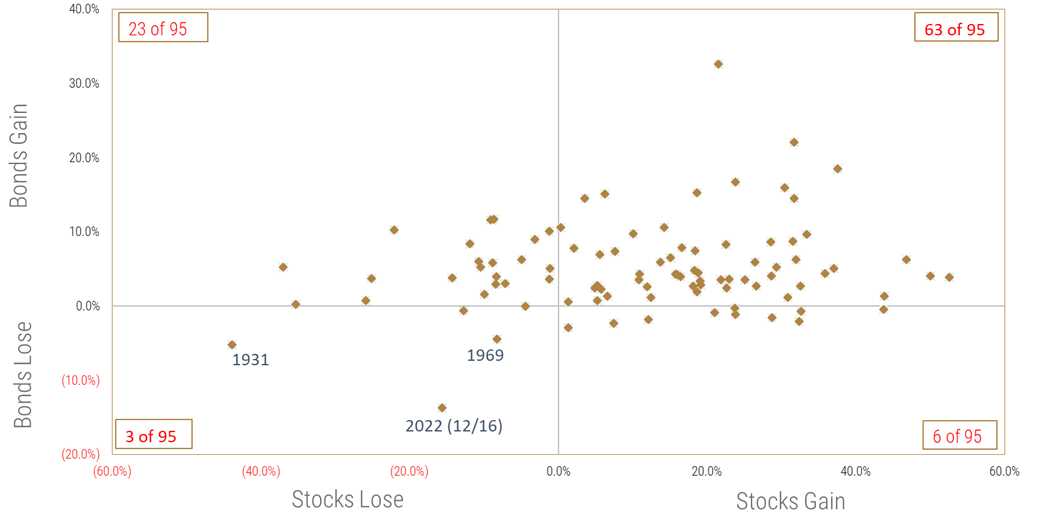
Investors – and managers like Viewpoint Investment Partners – that focus on diversification to manage volatility and drawdown risk were clearly challenged by the dual losses in both stocks and bonds in 2022. The unprecedented nature of these dual losses can be underscored by the fact that there have only been three years (1931, 1969, and 2022) where investors have seen losses of greater than 1% in both stocks and bonds. As most investors know, the value of diversification is rooted in the ability to build portfolios of investments that have low correlation. Since 1989, U.S. Stocks and U.S. Bonds have exhibited this low correlation, with an average daily correlation of -9.9%. However, in 2022 this correlation spiked to an average of 26.8%, which materially lowered the value of diversification in a stock-bond portfolio.
FIGURE 3: United States Equity & Fixed Income Returns (1928 to 2022)

Source: Data from 01/01/1928 to 12/31/1976 was sourced from the NYU Stern “Historical Returns on Stocks, Bonds and Bills” and presents the total return of the S&P 500 Index (SPX) and an Aggregate Bond estimate of 80% U.S. 10-Year Treasury and 20% BAA Corporate Bond Index. The data presented from 01/01/1977 to 12/16/2022 was sourced from Bloomberg and presents the total return of the S&P 500 Index (SPX) and the Bloomberg Aggregate Bond Index (LBUSTRUU).
Although historic performance is not an indicator of future performance, it may be worth considering the return profile seen after the 1931 and 1969 episodes. After the 1931 dual loss, stocks and bonds provided solid three-year returns, averaging 10.6% for equities and 8.6% for bonds. However, it should be noted that equity volatility remained elevated over this period and the bond returns were delivered with much lower volatility. After the 1969 dual loss, stocks and bonds provided solid three-year returns, averaging 12.0% for equities and 9.8% for bonds.With this tack towards a more positive prospective outlook, we can now consider Howard Marks’ recent monthly commentary, Sea Change, and his perspective that the challenges of 2022 have laid the groundwork for a much healthier investment opportunity set in 2023 and beyond.
We’ve gone from the low-return world of 2009-21 to a full-return world, and it may become more so in the near term. Investors can now potentially get solid returns from credit instruments, meaning they no longer have to rely as heavily on riskier investments to achieve their overall return targets. Lenders and bargain hunters face much better prospects in this changed environment than they did in 2009-21.
With all-time low interest rates over the past several years, the potential returns for fixed income over this period was limited. However, fixed income did play a very important role in diversification over the past number of years – at least until 2022. With the renormalization of interest rates seen in 2022, a fixed income allocation can now contribute positive returns to portfolios, as well as being a valuable diversifier to equity concentration risk.So, as we consider 2023, the opportunity set for Viewpoint Investment Partners is much healthier. Regardless of our views on the fundamental outlook for individual asset classes, Viewpoint’s proprietary risk parity engine intentionally builds portfolios with a keen focus on understanding and balancing risks. A superior portfolio construction engine, where risk is the initial consideration, allows investors the ability to rely on the power of the Diversification Premium, without worrying about being overly concentrated in any specific sector. Please reach out to the Viewpoint team if you would like more information on the Diversification Premium and how it may help your investment portfolios.
NOTE The VIX is the risk-neutral expected volatility of the stock market over the next 30 days and is calculated from options on the S&P 500 index. The VIX can be thought of as the sum of two components: expected actual volatility, which is interpreted as a measure of risk, and a variance risk premium, which is related to investors risk aversion. The MOVE index is constructed in a similar way to the VIX. It is a yield curve weighted index of the normalized implied volatility on one-month Treasury options, which are weighted on the two, five, 10, and 30-year contracts over the next 30 days. BIS Working Papers (No 606) Market volatility, monetary policy and the term premium (Kumar et al) June 2022
DISCLAIMER:
This blog and its contents are for informational purposes only. Information relating to investment approaches or individual investments should not be construed as advice or endorsement. Any views expressed in this blog were prepared based upon the information available at the time and are subject to change. All information is subject to possible correction. In no event shall Viewpoint Investment Partners Corporation be liable for any damages arising out of, or in any way connected with, the use or inability to use this blog appropriately.

