
From the Desk of Our CIO
Market Mirage or Canary in the Coal Mine? Unpacking the August Volatility
We’re just over halfway through the month of August and it feels like the market volatility from early in the month is firmly in the rear-view mirror. Global equity markets are now in the green for August, just shy of all-time highs. Although much of the damage in financial markets seems to have been fixed, we’ll look under the hood at some of the reasons for the recent spike in volatility, and whether this was an outlier market event to be swept under the rug, or if this was a canary in the coal mine.
While financial markets are too complex to attribute the mayhem experienced in early August to just a few major catalysts, the most likely spark that caused the tinder to ignite was the Bank of Japan (BoJ) unexpectedly raising interest rates from a range of 0.0-0.10% to 0.25% on July 31st. In the grand scheme of things, an interest rate hike of this magnitude doesn’t seem all that material, but this hawkish monetary policy move provided additional momentum for the Japanese yen, which was already strengthening.
An important segue to this story is that a popular trade in financial markets has been to borrow in Japanese yen at very low interest rates and convert the yen into another currency that offers a higher interest rate (like the U.S. dollar). This is what is known as a “carry trade.” An investor can earn the spread between borrowing at a very low interest rate in a foreign currency and investing those proceeds in a deposit account paying a higher interest rate in a different currency, with the aim of pocketing the interest rate differential between the two currencies. While the carry trade gained notoriety in currency markets, a carry trade can also be the simple act of using a direct investing account to buy equities on margin. In the latter example, the broker is charging you an interest rate for the stock loan, and the investor uses that loan to buy equities that should (hopefully) have an earnings yield that is higher than the cost of the loan. The proliferation of option writing strategies is another more complex form of carry, where investors will sell options to generate additional income in the hopes of bolstering their return profile.
For an investor to realize the expected profits of a carry trade (the interest rate differential or option income), the investor is essentially betting that current market conditions will remain the same in the future and the “financing spread” will accrue to the carry trade investor. The risk for carry trades is that your source of financing gets more expensive (reducing or negating your profits) or the collateral of your loan degrades to the point where margin calls are required. In the example of the yen carry trade, as the yen strengthens, the cost of your loan increases as it now costs more foreign currency units to repay the underlying yen loan, eating into your financing spread. Once a carry trade starts to falter, there can be a liquidity cascade where margin calls force investors to unwind their trades, further exacerbating the market forces already putting negative pressure on a trade. There is an adage in currency markets that the carry trade is akin to picking up nickels in front of a steam roller—and boy did that steam roller come at the end of July.
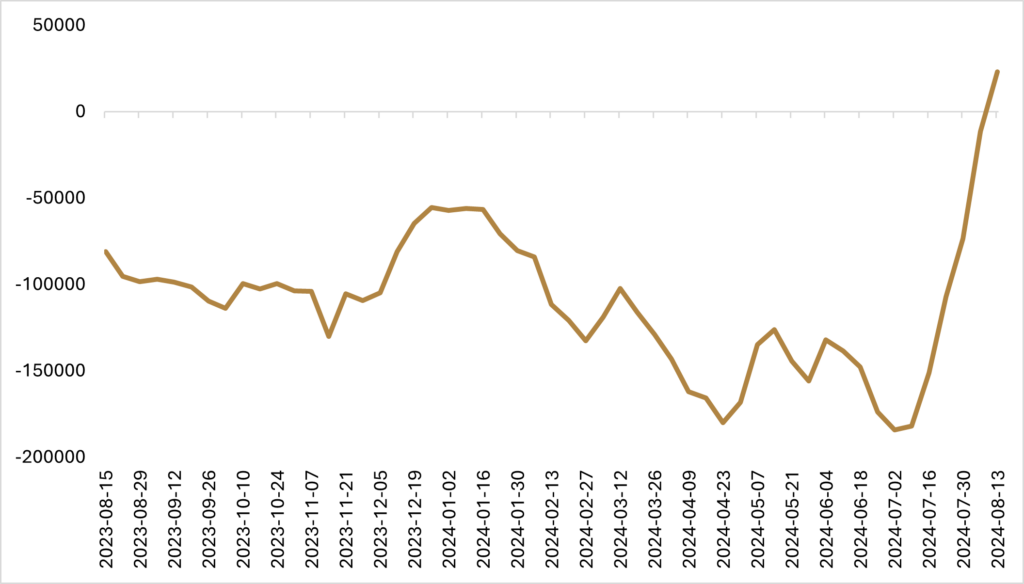
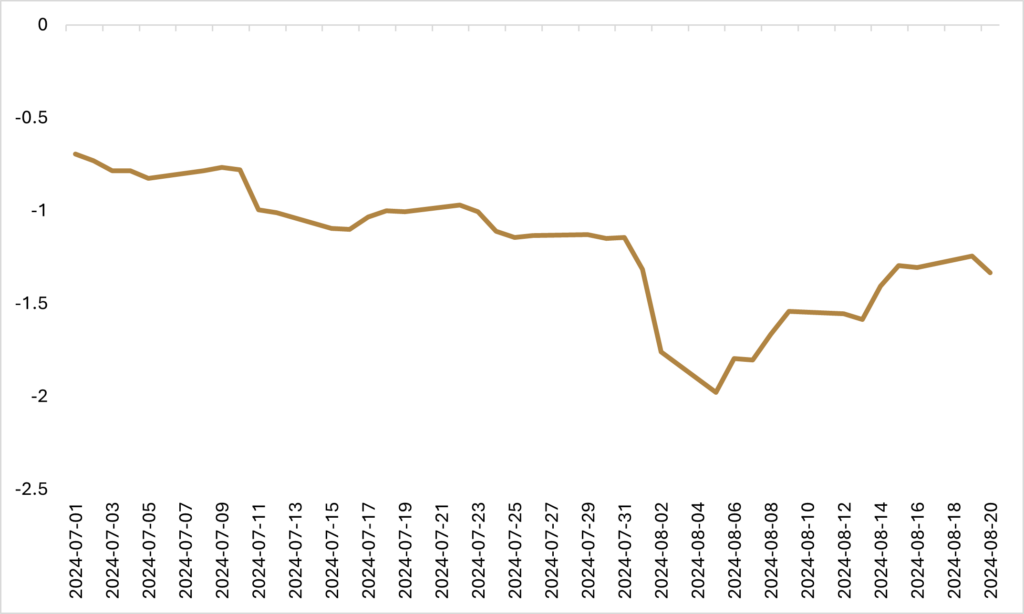
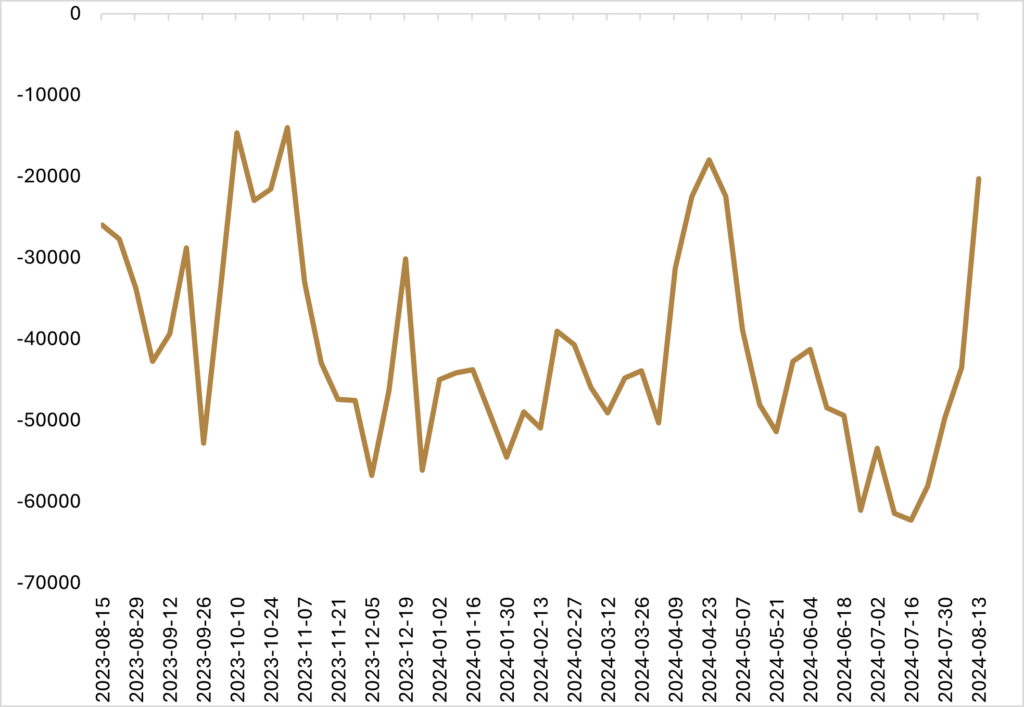
The yen carry trade had been quite profitable in 2024 with a large financing spread relative to both developed and developing market currencies. The popularity and success of the trade led to more participants borrowing in yen, creating constant selling pressure on the yen, which caused it to weaken by -15% against the U.S. to the end of June. Carry trades are a good example of a positive feedback loop, where the success of a trade makes it more popular and adds to the positive momentum, but ultimately, they become unstable and victims of their own success. While the futures market is only a small fraction of the total yen carry trade (estimated to have grown to $500B at its peak), the Commitment of Traders Report from the CFTC showed the stark short position that speculative traders had built up against the yen in the first half of 2024.
However, this all started to unravel in July as the yen rallied +7% against the greenback and then gained another +2% in the first two days of August after the surprise interest rate hike by the BoJ at the end of July. The sharp rally in the yen and the unwind of its carry trade was the first domino to fall for global risk appetite, as the stronger yen put downward pressure on Japanese equities (Japanese equities tend to be inversely correlated to the value of the yen due to their reliance on exports) with the TOPIX Index falling by -9% in the first two days of August, before dropping -12.5% on August 5th.
In conjunction with what was the beginning of an unwind in the yen carry trade, U.S. employment data came in weaker than expected on August 2nd, with the unemployment rate increasing to +4.3%, thus triggering the Sahm Rule Recession Indicator. This spooked markets into re-pricing the potential for a recession from a very low probability to something much more material, and in the process, market participants were forced to unwind some of their risk profile, steamrolling another popular carry trade: option selling and short VIX futures.
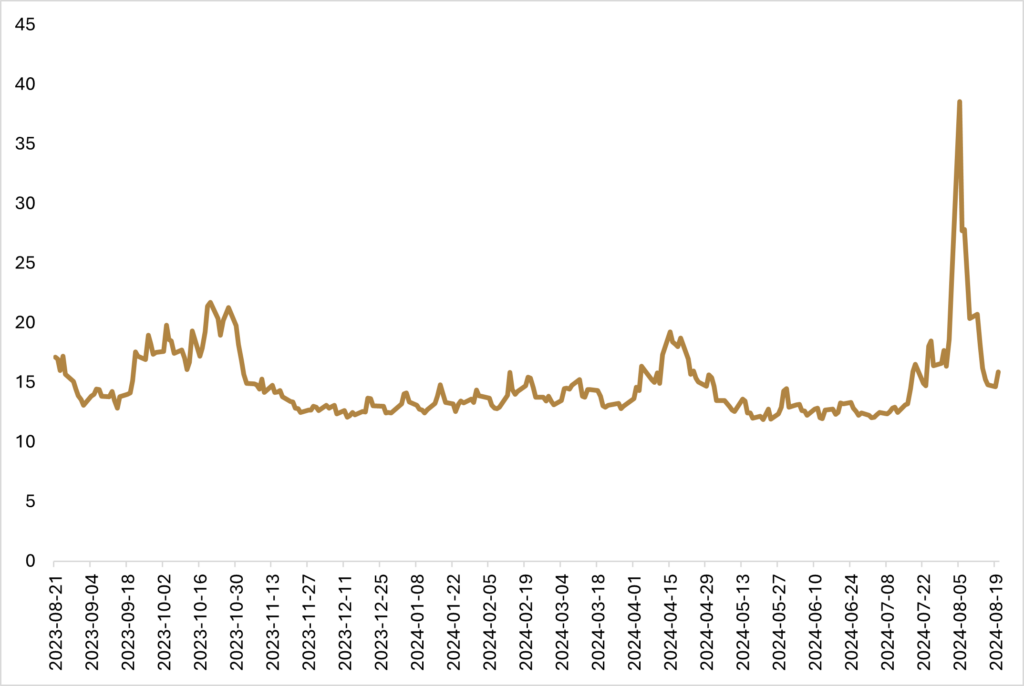
The Cboe Volatility Index (VIX) is a measure of near-term volatility conveyed by S&P 500 Index option pricing. Without getting into too much nuance, the futures curve for the VIX index is generally upward sloping, given events in the future are more uncertain than events in the near term, thus garnering a higher implied volatility. An investor can go “short” or “sell” front-month VIX futures, and if implied volatility stays above realized volatility (current conditions remain the same in the future), then an investor can harvest the carry from the upward sloping futures curve as the price of the VIX future converges to a lower price. With the re-pricing of a recession causing market participants to cover some of the short volatility trades in options and futures markets, the cash VIX (which isn’t a tradable index but is based off S&P option pricing with a weighted average maturity of 30-day volatility), which closed at 23.4 on Friday, August 2nd, had an intraday spike to 65.7 before closing at 38.6.
The interesting thing about this episode of volatility in financial markets was that while you could argue it was started in part by fundamental reasons and the re-pricing of recession risk, the reaction in volatility markets was much more pronounced than in the underlying equity indices (except for Japan). Running a linear regression of historical VIX prices on the S&P 500 illustrates that for every +1% move in VIX (volatility points), you should expect a -0.54% change in the S&P 500. On August 5th, the intraday spike in VIX was an increase of just over +40% relative to its closing price on Friday, which (based on linear regression) would correspond to a -20% drawdown in the S&P. Because of the inherent convexity in options, tail events like these don’t fit well into traditional linear regression, but even so, at its trough, the S&P 500 was only down -4%, showcasing that the size of the volatility move wasn’t necessarily being driven by underlying weakness in equities or the real economy.
While it seemed like volatility measures had gotten ahead of the weakness in stocks, this doesn’t mean that it was a foregone conclusion that this burst of volatility would soon subside and by mid-month it would have appeared as if nothing happened. The intraday spike in VIX subsided by the end of the day, and margin calls that could have been bigger were of a more manageable size, allowing carry trade investors to come back into the market and re-place short volatility trades at more favourable levels, creating an excess supply of volatility to dampen the VIX. Equities remained on edge early until unemployment claims came in stronger than expected on August 8th, easing worries that the labour market was deteriorating at a faster clip than the markets or the Federal Reserve (Fed) had anticipated.
During the short-lived explosion in volatility, market participants had briefly priced in an emergency rate cut from the Fed, as well as fully pricing in a jumbo (50 basis point) rate cut in September. As risk appetite regained its footing, we are effectively back to where expectations were at the end of July, with just slightly more than one rate cut fully priced in for the September Fed meeting, which will be a week and a half after the next U.S. employment report.
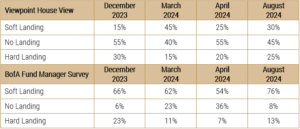
There hasn’t been a material shift in Viewpoint’s expectations around the potential for a hard landing, as we’ve previously noted that the labour market had been showing signs of softening and should it continue to deteriorate, we will ratchet up the likelihood of a recession in the U.S. Back in April, we had marked the probability of a recession at 20%, relative to the BofA Fund Manager Survey that showed a probability of 7%. With further softness in the labour market and the triggering of the Sahm rule, we are increasing our probability of a recession to 25%.
The Bureau of Labour Statistics (BLS) also just released an estimate that the increase in jobs through the 12 months to March of 2024 will likely be revised lower by 818,000, signaling that job growth in the U.S. was far less robust than had been reported. The BLS had reported that the U.S. economy added 2.9 million jobs over the 12-month period to March 2024, averaging 242,000 per month. With job gains being marked lower by just under 1M, the average monthly jobs gain will now be closer to 174,000 per month. There is a caveat that given the labour force growth, downward revisions were to be expected, as the original payroll figures count undocumented workers and the source for the revisions is taken from unemployment insurance tax records that wouldn’t include undocumented workers. These revisions are still likely to be concerning for Jerome Powell and the Fed, who at the last interest rate policy meeting communicated that the Fed doesn’t want to see any more weakness in the labour market.
While the Sahm rule as a recessionary indicator should be respected given how integral the consumer and discretionary spending are to economic growth, one key question mark is how impactful an increasing labour supply has been in driving up the unemployment rate. Although a reduction in the pace of new job creation will start to taper employment income and thus consumer spending, the prospect of interest rate normalization from Fed interest rate cuts could help to spur economic demand and therefore job creation, helping to combat some of the increased labour force participation.
The softness in the labour market has yet to trickle through to the underlying economy and consumer spending remains resilient as witnessed by last week’s retail sales figures. Additionally, company fundamentals are strong with Q2 showcasing that both sales and earnings growth remain strong. Upside earnings surprises for S&P 500 companies have moderated somewhat but continue to surpass analysts’ expectations, beating them by a roughly 4% margin on an aggregate basis. Financial conditions continue to remain accommodative, with the downshift in the pace of quantitative tightening (the amount of bonds the Fed is allowing to roll off its balance sheet without being replaced) helping to mitigate otherwise additional treasury supply hitting the market.
While the balance of probabilities lays outside of a hard landing, price action from early August does highlight an underlying risk that markets may still not be adequately pricing in the potential for a recession and that if there is additional weakness in the labour market, we could experience another event like early August. The next U.S. employment report on September 6th could be a significant source of volatility, and investors may want to be thinking about ways to position their portfolio heading into the event if they are worried about withstanding the volatility that could be associated with a weaker-than-expected print. While speculative positioning in yen futures has bounced into net long territory, other en vogue carry trades like VIX futures remain net short, underscoring the potential for sharp moves should there be more negative-than-expected economic data on the horizon.
Adding long volatility protection to portfolios comes with operational complexity and might be outside what is accessible as part of someone’s portfolio construction, but what has been beneficial for portfolios this month has been fixed income exposure, which regained its safe-haven profile during the most recent volatility event and exhibited a negative correlation to equity markets. Back in June, I released a note stating that it would make sense to start lengthening fixed income duration back to benchmark, given we had seen some weakness in the labour market and the Fed seemed motivated to start reducing interest rates. Long-duration fixed income may not have the same magnitude of positive convexity that a long options strategy does, but in a high-interest rate environment, on-the-run treasuries do have positive convexity due to their larger coupons, and increasing exposure as a tactical hedge in case a hard landing materializes could be beneficial from a risk-management perspective, without creating too much of a drag on portfolio returns. The tricky part from a portfolio construction perspective is that the U.S. election news cycle is in full swing, and long-duration fixed income could be susceptible to weakness based on campaign promises, which will result in a widening of the budget deficit.
Happy investing!
Scott Smith
Chief Investment Officer
ABOUT THE AUTHOR

DISCLAIMER:
This blog and its contents are for informational purposes only. Information relating to investment approaches or individual investments should not be construed as advice or endorsement. Any views expressed in this blog were prepared based upon the information available at the time and are subject to change. All information is subject to possible correction. In no event shall Viewpoint Investment Partners Corporation be liable for any damages arising out of, or in any way connected with, the use or inability to use this blog appropriately.