
From the Desk of Our CIO
Is It Time to Start Buying Duration?
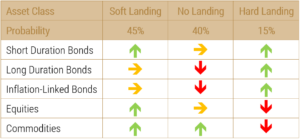
At Viewpoint, we’ve been in the camp that the current macroeconomic backdrop isn’t conducive to the Federal Reserve (Fed) being able to skirt a recession and reduce interest rates back to a long-term equilibrium, all while inflation remains under control. This is what would otherwise be known as a “soft landing.” Back in March, I did increase my probability for a soft landing, given that the Fed seemed extremely committed to lowering interest rates despite increasing their inflation forecast, though my balance of probabilities rested in a combination of “no-landing” or “hard-landing” scenarios. To wit “…I remain skeptical given how financial markets have responded to forward guidance and worry that the continued easing of financial conditions makes it more likely that we are in a no-landing type of environment until restrictive monetary policy breaks something and induces a hard landing.”
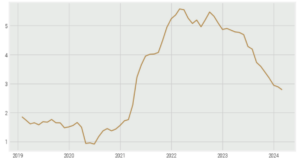
The latest round of economic data that dropped this week continues to be supportive of a “no-landing” type of scenario, as consumer spending and inflation remains hot. Today’s core personal consumption expenditures (PCE) out of the U.S. – the Fed’s preferred measure of inflation – came in at +2.8% on a year-over-year basis for March, higher than the +2.7% rate that was expected. This slightly warmer inflation number comes on the heels of Thursday’s U.S. advanced GDP numbers, where GDP for the first quarter missed expectations. First quarter GDP in the U.S. expanded by +1.6% on an annualized basis, falling short of the +2.5% economists had expected, and much cooler than the +3.4% rate from Q4. Consumer spending and housing investment accounted for a good chunk of the growth in the quarter, showcasing that consumer activity remains robust. As a result of the incoming economic data, financial market participants have now scaled back their expectations of rate cuts from the Fed to only one cut in late 2024. This is an interesting turn of events for interest rate expectations, given that, in January, market participants were expecting the Fed to deliver six interest rate cuts throughout 2024.
With respect to how this affects fixed-income portfolio allocations, at Viewpoint, we’ve been bearish towards duration for quite some time. We have advocated for some longer-term bonds in a portfolio as a hedge for a potential hard-landing scenario. But until that probability ratchets up further, our view has been to be underweight duration across a fixed-income portfolio. Our thesis is that there aren’t many attractive reasons to have longer-term rate exposure, as inflation remains sticky, the yield curve is deeply inverted, and term premium is negative. Given expectations for interest cuts have been ratcheted back in 2024, duration has underperformed this year, particularly over the last month. Year to date, 10-year U.S. government bonds are down -5.3%, while two-year U.S. government bonds are only down -2.0%.
Although duration has underperformed this year, we still think it’s too early for investors to move back to benchmark duration in their fixed-income portfolios. While the probability of a hard landing is likely to increase the longer interest rates remain high, it is too early to confidently jump into the hard-landing camp, which is when you would want duration in your portfolio. If the employment market starts to meaningfully crack, then a hard landing becomes an increased probability, and you’d want to then be shifting your duration exposure into longer-term fixed-income instruments. Furthermore, while duration has underperformed, the yield curve remains inverted with the term premium still in negative territory. If these start to increase, then it becomes more attractive to start lengthening bond duration, as the knock-on effects are tighter financial conditions, which may have already started to trough (lower reading = looser financial conditions).
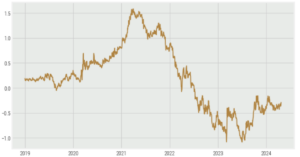
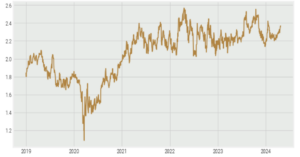
I wouldn’t anticipate that financial conditions will tighten too much this year, as the probability of strong equity market performance is high, given that it’s an election year and the U.S. continues to run a large budget deficit as a percentage of GDP. The path of least resistance in financial markets is middling performance of fixed income, while equity markets remain volatile but on an upward trajectory, barring any major escalation of geopolitical tensions. You’ll have to squint on this next chart, but we’ve started to see some upward momentum in the 5-Year, 5-Year Forward Inflation swap market, which measures expected inflation over the five-year period that begins five years from today. Essentially this is a longer-term inflation measure to gauge how well expectations are anchored around the Fed’s target of 2%. We’ve been in the camp that inflation will likely settle higher on a longer-term horizon, though we’ve yet to see this borne out by market expectations.
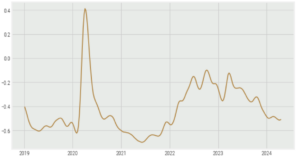
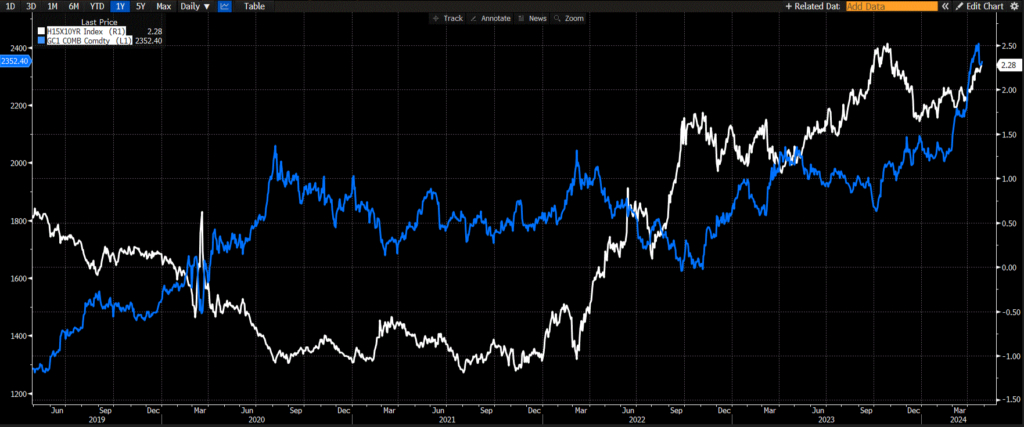
This next chart has been making the rounds lately and is worth pointing out here. The chart shows the 10-year real yield as measured by inflation-linked bonds (RHS) with an overlay of gold futures (LHS). Because gold is an asset class with zero yield (negative yield if you consider storage costs), generally its price is negatively correlated to real yields. As real yields rise, the opportunity cost to hold gold increases, making it less attractive to do so. However, since the start of 2024, real yields and gold prices have been moving in the same direction, leading many to wonder where the strong demand in gold is coming from. I briefly touched on this strong gold demand in a note earlier this month, discussing foreign central bank demand and retail demand for China. Squaring this narrative as it relates to the macroenvironment, investors may be more worried about the inflationary environment than what is being priced into the inflation swap market and are increasing their gold exposure as a hedge against further upside inflation surprises.
In conclusion, I think it’s too early to meaningfully increase duration exposure in fixed-income portfolios back to benchmark weights, and investors should be exploring alternative options for diversification within portfolios. With deficit spending in the U.S. unlikely to abate throughout this election cycle and inflation running stickier than policymakers would like, bonds will likely continue to tread water, until worries of a hard landing begin to meaningfully rise. We continue to recommend an overweight commodities position for investor portfolios, funded from an underweight fixed-income position.
Happy investing!
Scott Smith
Chief Investment Officer
ABOUT THE AUTHOR

DISCLAIMER:
This blog and its contents are for informational purposes only. Information relating to investment approaches or individual investments should not be construed as advice or endorsement. Any views expressed in this blog were prepared based upon the information available at the time and are subject to change. All information is subject to possible correction. In no event shall Viewpoint Investment Partners Corporation be liable for any damages arising out of, or in any way connected with, the use or inability to use this blog appropriately.