
Despite swirling uncertainty around trade policy, global equity markets have shrugged off the noise with U.S. stocks rallying back to levels last seen in February. The latest spark was the May jobs report for the U.S that came in stronger than expected, with 139,000 new positions added—enough to boost sentiment, but not enough to ease underlying concerns. Beneath the headline figures, downward revisions of 95,000 jobs for March and April paint a picture of a labour market slowly losing steam. The unemployment rate held steady at 4.2%, but it’s inching up on an unrounded basis, edging dangerously close to 4.3%. For the Federal Reserve (Fed), this lukewarm report complicates the interest rate path. It is not weak enough to demand immediate interest rate cuts without first gaining more clarity on how trade policy will affect inflation. Meanwhile, average hourly earnings rose 3.9% year-over-year—hotter than expected—raising fresh questions about sticky wage inflation and its knock-on effects for broader prices. U.S. consumer prices for the month of May are due on Wednesday of this week, and financial markets will be paying close attention to how tariffs are filtering through to consumer prices.
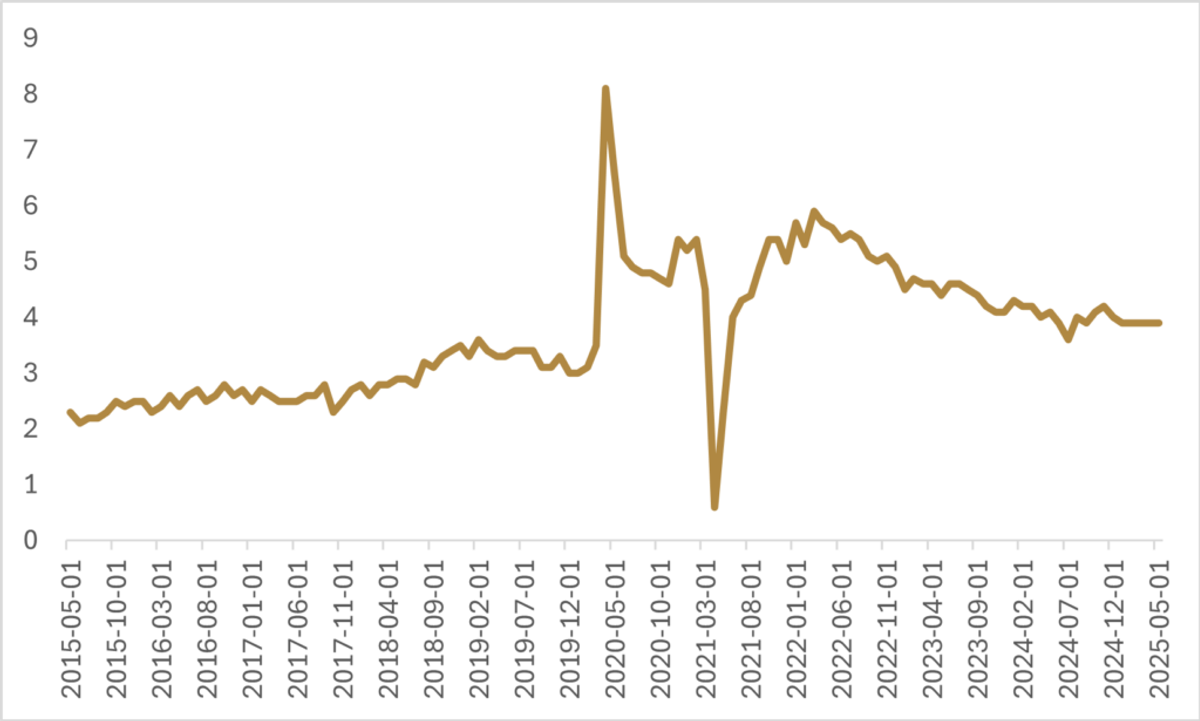
FIGURE 1: U.S. Average Hourly Earnings, Year-Over-Year Percentage Change (2015 – 2025) (Source: Bloomberg, BLS)
Bond markets took a hit Friday, with a bear flattening of the yield curve reflecting expectations that the Fed will stay on hold until at least September. Markets are now pricing in fewer than two cuts for 2025, and the projected terminal rate has once again crept up to 3.4% by late-2026. If we assume a normal, upward-sloping yield curve, this would put the (rough) fair value for the 10-year yield just below 5%, spitting distance from the 4.5% where the 10-year currently sits. Eyes remain on trade negotiations and the fate of the “One Big Beautiful Bill” (OBBB), which passed the House and is now being debated in the Senate. The Congressional Budget Office (CBO) estimates the OBBB would add $2.4 trillion to the deficit over the next decade—less than the Committee for a Responsible Federal Budget (CRFB) estimates but still material. Meanwhile, the CBO estimates that tariff revenues would reduce the deficit by $2.8 trillion over that period, though that assumes tariff levels hold at current levels, which is far from certain and not the base case being communicated by the administration. The CRFB estimates that the OBBB will increase the deficit to 7.0% of GDP by 2026, an increase of 1.5% relative to current law, while increasing the current debt load from 100% of GDP to 124% of GDP by 2034.
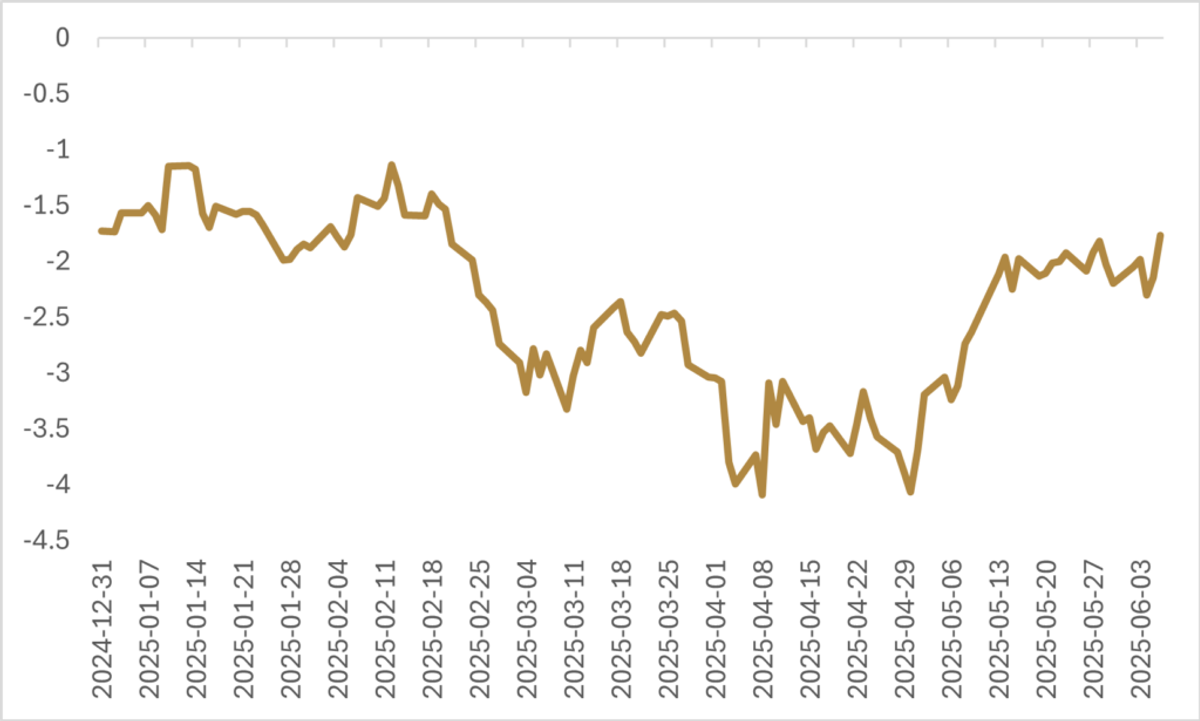
FIGURE 2: Number of Estimated Fed Rat Cuts, Futures Pricing (2025 Year-To-Date) (Source: Bloomberg)
For bond investors, everything hinges on how trade negotiations unfold in the months ahead. If talks break down, higher tariff revenues may improve the deficit math—but it will also likely keep the Fed from cutting short-term rates. Long-term yields, meanwhile, could rise less than short-term rates if protectionist policy dampens growth, resulting in a bear-flattening of the yield curve. A string of successful deals, on the other hand, could ease short-term inflation concerns and fuel global growth, but decreased tariff revenue will likely steepen the yield curve as the 10- and 30-year yields push higher. The only clear bull case for longer-term bonds would be meaningful fiscal restraint—but after the underwhelming savings from the DOGE initiative, the rhetoric from the administration has shifted from “fiscal detox” to “growth will solve everything,” which doesn’t inspire confidence. Markets aren’t convinced the OBBB will meaningfully boost domestic consumption, especially since its tax cuts skew toward higher earners, who tend to have a lower marginal propensity to consume than lower earners. The rollback of clean energy tax credits further limits infrastructure spending—typically a higher-impact fiscal lever than tax cuts. Until there’s concrete progress on deficit control in the Senate, long duration will likely struggle to catch a bid.
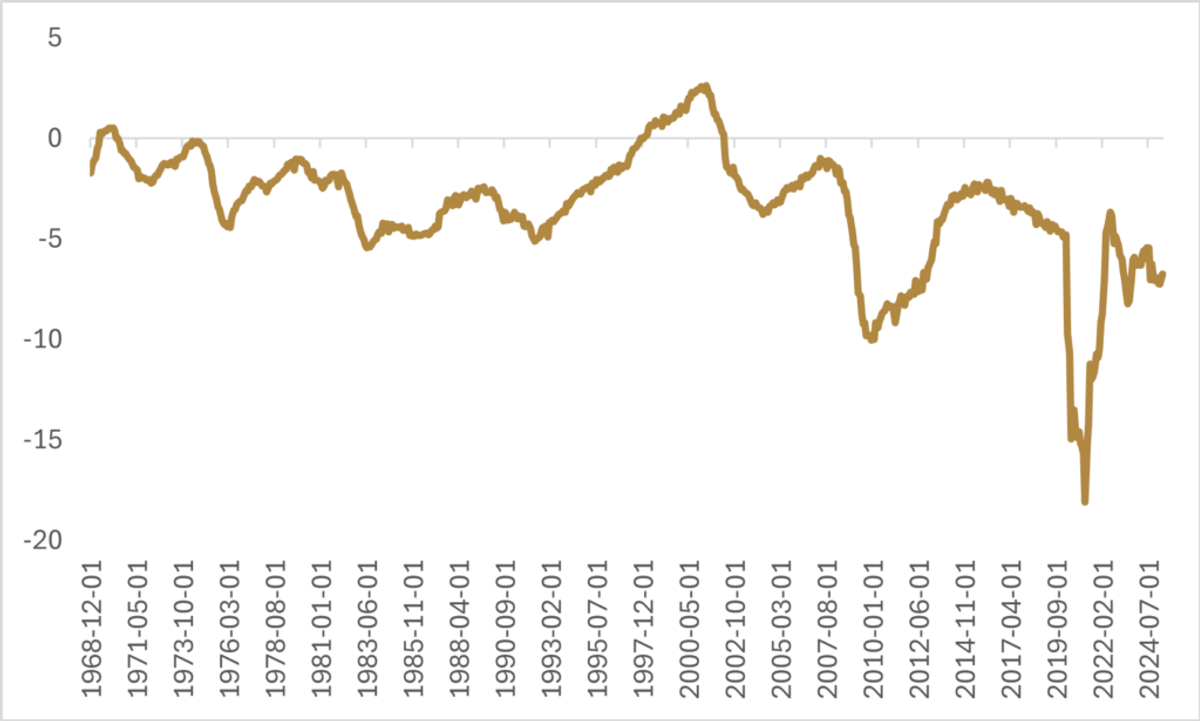
FIGURE 3: U.S. Budget Deficit, Percentage of GDP (1968 – 2025) (Source: Bloomberg, U.S. Treasury)
As if trade uncertainty wasn’t enough, Section 899 of the OBBB is raising red flags for global investors. Aimed at punishing countries with “discriminatory” taxes on U.S. firms—like Canada’s Digital Services Tax and Undertaxed Profit Rule—Section 899 could override existing tax treaties. Canadian investors, currently paying 15% withholding tax on U.S. dividends, could see that jump to 30%, with another 20% phased in over four years. Even registered retirement accounts, typically exempt, may no longer be shielded. While Section 899 could have massive implications for Canadian investors, the proposal is so broad that it could affect countries that account for “more than 80% of all foreign direct investment into the United States.” Goldman Sachs released a note suggesting that discriminatory foreign countries, as described by Section 899, make up 63% of foreign U.S. equity holdings and 41% of foreign U.S. long-term treasury holdings. The provision also casts doubt on whether central banks and foreign governments will be exempt from withholding tax on U.S. Treasuries—a potential game-changer for global treasury demand and term premiums. While some view the clause as negotiating leverage, its enactment would add yet another reason for foreign investors to rethink U.S. asset exposure.
We have talked previously about how the weaponization of the U.S. dollar through increased use of sanctions has led to the dollar’s declining share of global foreign exchange reserves, and if the U.S. administration is now willing to weaponize capital markets for trade negotiations, this is additional policy uncertainty that is unlikely to bode well for foreign capital flows into the U.S. With the U.S. dollar already down 9% this year and U.S. equities underperforming international peers, Section 899 only reinforces the case for international diversification. While speculative positioning against the U.S. dollar in futures markets continues to remain elevated, we will have to see positive developments on fiscal policy before we can get bullish on either the U.S. dollar or U.S. duration.
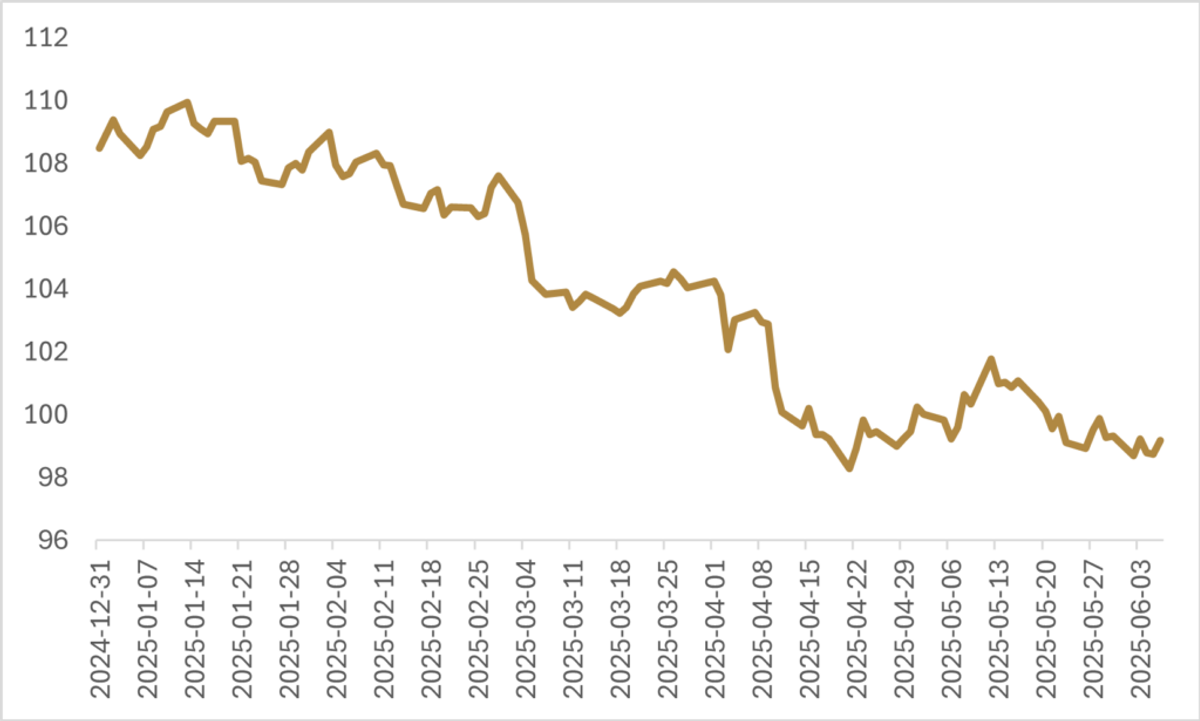
FIGURE 4: U.S. Dollar Index (Year-To-Date 2025) (Source: Bloomberg)
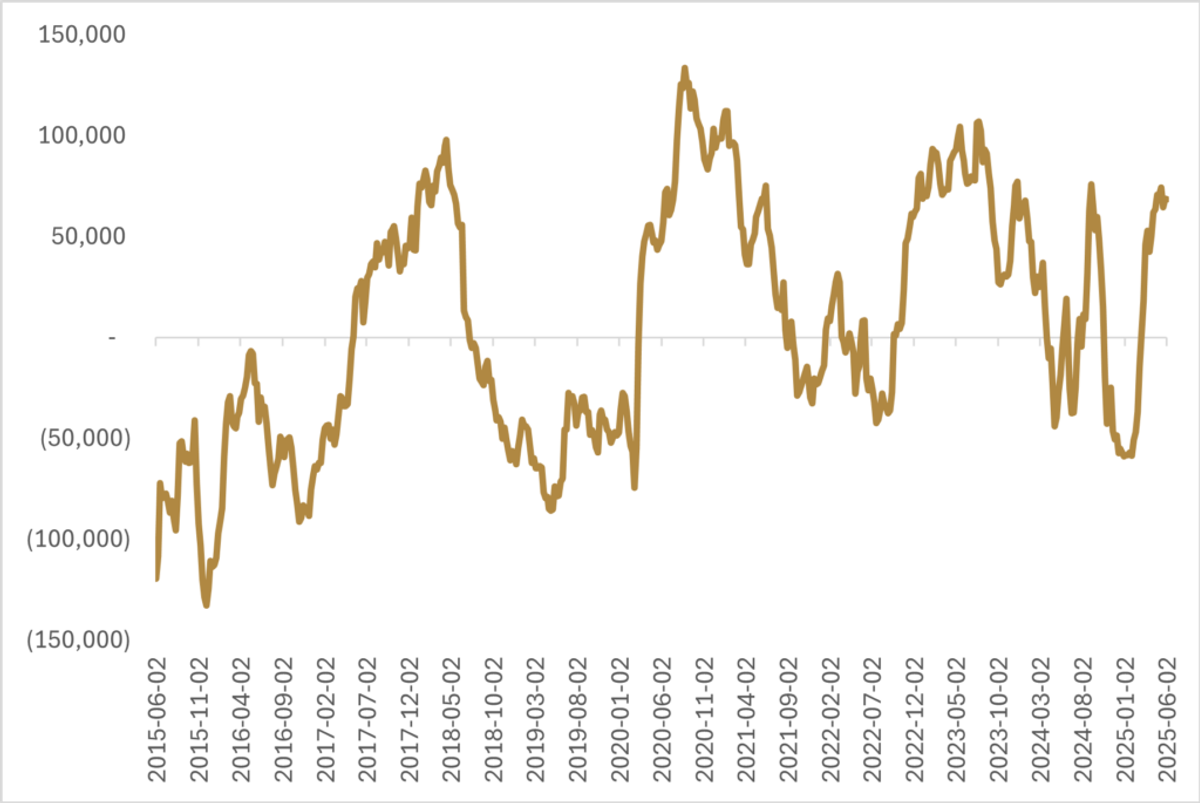
FIGURE 5: CFTC COT Report, Non-Commercial Net Futures Contracts, DXY Proxied Basket (2015 – 2025) (Source: Bloomberg, CFTC)
Happy investing!
Scott Smith
Chief Investment Officer