
News & Insights
How Commodities Can Give Your Portfolio a Fresh Start
Katy Milkman authored a book that was published in 2021 titled “How to Change – the Science of Getting from Where You Are to Where You Want to Be.” Milkman is a behavioural scientist and a professor at the Wharton School of the University of Pennsylvania and specializes in change management. In the book, Milkman discusses how people perceive the passage of time, thinking about their lives in “episodes”, from which narrative arcs can be created based on notable events. The way that time is perceived is the catalyst for what is described as the “fresh start” effect, and why many individuals take the opportunity of a new calendar year to embark on change management through resolution goal setting. Milkman’s research studied Major League Baseball (MLB) players to illustrate the fresh start effect. In the MLB, when a player is traded to a team in the opposite league (National League vs. American League) their statistics get calculated anew, as if their season just started. Alternatively, if the player is traded to a team within their current league, their statistics for the current year don’t reset. The research from Milkman shows that fresh starts can be detrimental when an individual has positive momentum and is performing well; however, fresh starts can jolt you into constructive change when you are struggling.
“How to Change” must have been on the Federal Reserve (Fed) Chair, Jerome Powell’s, reading list. Retiring the word “transitory” from the Fed’s lexicon at the end of 2021 set the stage for the Fed and other major central banks to telegraph that they would be aiming to rectify the perception that they are behind the curve when it comes to battling inflation. Powell then used the fresh start of 2022 to communicate more meaningfully to financial markets that tackling rising consumer prices is priority number one for the Fed. The proverbial punchbowl of liquidity is in the process of being removed, with interest rates rising in anticipation of one of the more hawkish central bank responses financial markets have witnessed since the Volcker-era. Markets are pricing in an additional 250 basis points of rate hikes by the Fed this year, which would bring the overnight lending rate to roughly 2.7% by the end of 2022, surpassing the pre-pandemic high from 2019. A similar situation in Canada has materialized, as market participants expect the Bank of Canada to raise the overnight lending rate another 200 basis points by the end of the year, which would bring the overnight lending rate well above pre-pandemic levels. As a result of the 2022 hawkish pivot, Canadian bond yields have risen drastically, with the 10-year yield rising by almost 1.5% year-to-date (figure 1).
FIGURE 1: Canadian Yield Curve
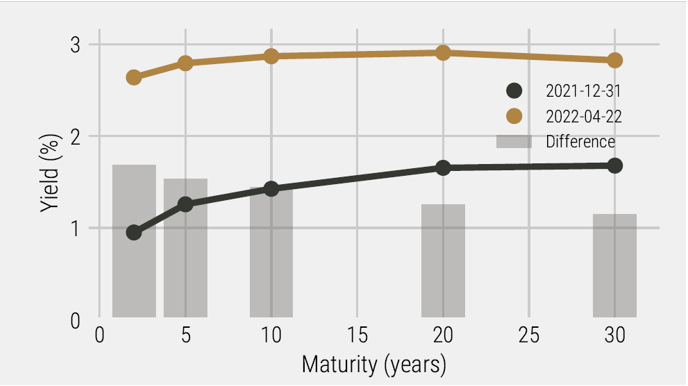
Source: Bridgewater
The ferocious pace of rate increases has transformed how people view the riskiness of their bond holdings, and the exodus of capital has caused the Bloomberg Canada Aggregate bond index to fall by 10% year-to-date (to April 22nd). This is not an ideal development for investors that hold a traditional 60/40 portfolio of stocks and bonds, as rising interest rates are also putting downward pressure on equities due to growth concerns. Unlike 2021, when rising equity markets were able to mask some of the bleeding in bond markets as inflation began to percolate, 2022 has not been kind to balanced portfolios.
Regardless, the hawkish shift of central banks towards taming consumer prices is warranted. Headline consumer prices (in the US) have increased +8.5% on a year-over-year basis, while core prices (ex-food and energy) have increased +6.5% over a similar timeframe. There are some “base effects” to consider given consumer prices decreased drastically during the start of the pandemic. However, headline prices have increased by +3.6% on an annualized basis over the last 5 years, which is well ahead of the Fed’s “average” price target of a +2% increase. Compound annual growth rates for headline inflation are less scary at +2.3% if you begin your analysis from 2009 onwards, but not many people care about the low rates of inflation seen over the last decade if their food bills are skyrocketing today.
The good news for the Fed is that they will get a helping hand from the government as the fiscal contribution to GDP growth is likely to detract between -2.5% and -3.0% this year as pandemic stimulus expires. The bad news is that additional developments with the war in Ukraine are out of their control, and the ramifications of continued supply chain disruption for food and energy prices is a concern for consumer prices in the short-term. The spread between headline and core inflation is the largest it has been since 2011 (figure 2), only surpassed by the 2008 period when energy prices were skyrocketing.
FIGURE 2: US Headline Inflation Minus US Core Inflation
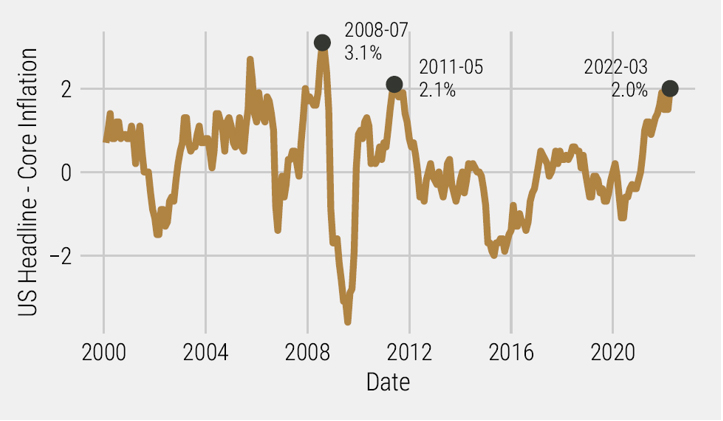
Source: Bridgewater, Internal Calculations
Even though the Fed and other major central banks may be communicating a tough stance on inflation, there is only so much that lays within their control. Food and energy supply chains that have been disrupted by the war in Ukraine aren’t going to be fixed with a higher overnight lending rate. While consumer borrowing and demand for loans is likely to be negatively affected as rates rise, substitutions are notoriously hard to implement when it comes to basic needs like food and energy, especially in the short-term.
AQR released a paper titled “When Stock-Bond Diversification Fails” in late 2021 showcasing how a traditional 60/40 portfolio of stocks and bonds has a negative correlation to inflation, underperforming when there is an inflationary episode. This is exactly what has transpired this year, with a 60/40 portfolio down almost -10% to April 22nd. To help improve the resiliency of a balanced portfolio, the authors of the paper recommended seeking macro diversification, making commodities a prime candidate for a core portfolio holding given their long-term risk premium and positive inflation exposure properties.
We at Viewpoint agree with AQR. Adding a commodity allocation to a 60/40 portfolio to protect against inflation surprises, increases the robustness of the portfolio. A 60/40 portfolio (60% MSCI ACWI Index and 40% Bloomberg Global Bond Aggregate) from 2005 to April 22nd of 2022 would have returned +6.4% annualized with a Sharpe of 0.75. However, if the portfolio had a 10% allocation to commodities (by reducing equity and fixed income allocations by 5% each) this would have increased the portfolio return by +0.2% annualized, while critically reducing volatility by -0.6% to produce a meaningful improvement in the Sharpe ratio.
FIGURE 3: Backtested Portfolio Returns
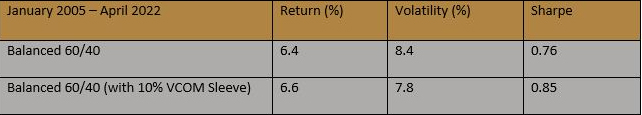
Source: Bridgewater, Internal Calculations
The 10% allocation to commodities used in this example is the model return stream of the Viewpoint Commodities (VCOM) strategy backtest and not indicative of future returns. However, the historical model is a good illustration of why adding a slice of commodity exposure to a traditional 60/40 portfolio can help to bulletproof portfolios in the context of inflation surprises. Adding a 10% allocation of VCOM to a balanced portfolio would have also reduced the year-to-date drawdown from -9.9% to -7.3%, a substantial reduction in portfolio risk as both equities and bonds struggle to contend with rising interest rates.
A rational rebuttal would be that commodities have only started performing well again after spending the better part of a decade underwater, only recently getting back to similar levels seen near the end of 2014. Therefore, would investors have been able to stick with an allocation to commodities through the normal cyclicality that commodity markets exhibit? Letting the data decide, we can analyze the 5-year period of 2015 to 2019 where one could make the claim having commodities in a portfolio was as good as dead money. Figure 4 shows that even though an allocation to commodity markets may have detracted from the absolute return of the portfolio over this period, volatility was significantly reduced, thus making no difference in the Sharpe ratio between the two portfolios.
FIGURE 4: Backtested Portfolio Returns
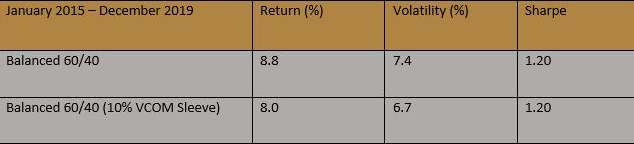
Source: Bridgewater, Internal Calculations
One of the reasons that an allocation to the VCOM model detracted less absolute performance over this period than one might expect, is a product of the unique portfolio construction of the strategy. The VCOM strategy is a differentiated offering due to each commodity sub-sector contributing the same amount of risk to the overall portfolio, which is much different than other offerings that may weigh commodity sub-sectors based on production levels or economic importance. This risk-aware approach to portfolio construction results in an extremely efficient commodity portfolio, with a lower volatility profile than comparable long-only offerings available to investors.
If you look under the hood at the asset class allocation of the iShares S&P GSCI Commodity ETF (ticker GSG) in figure 5, you can see the allocations of the VCOM strategy are much more diversified from a capital allocation standpoint. VCOM is also less reliant on the performance of energy, a commodity sub-sector that tends to be the most volatile. Illustrating the results of a data driven process with more signal and less noise, from the period of 2015 to 2019, the index that tracks the iShares commodities ETF returned -4.7% annualized with a volatility of 19.9%. In comparison, the VCOM model returned -0.6% annualized with a volatility of 9.3%.
FIGURE 5: Asset Class Allocations
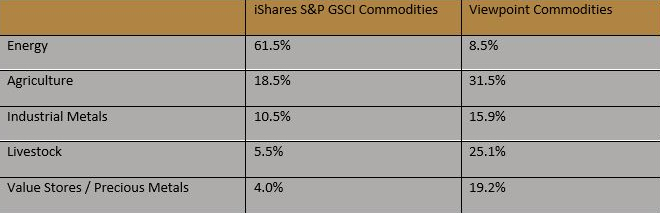
Source: iShares, Internal
While energy markets have been performing exceptionally in 2022, we’re also seeing a remarkably strong performance across agriculture and industrial metals markets, showcasing that inflation can materialize through a variety of different commodity channels; channels which have traditionally been hard for investors to get direct exposure to.
For investors that have historically viewed investments in Canadian oil and gas stocks as sufficient inflation protection, it might be a good time to re-evaluate whether the company-specific risk still makes sense in an environment where there is likely going to be continued regulatory pressure on emissions. Taking an unbiased look at the data, the S&P TSX Energy Index is only up +42.5% this year (to April 22nd), which is fantastic, but a direct investment in oil futures (adjusted for roll) is up +48.6% while natural gas is up +177.9% (also adjusted for roll).
At Viewpoint, we believe that in order to construct portfolios with the best possibility of being robust to upside inflation surprises, investors should be looking to directly own the commodity, not the company.
It is never too late for a fresh start as it relates to your portfolio’s narrative arc. Investors that haven’t embraced the role that an allocation to commodities can play in their portfolio can turn this challenging first quarter of 2022 into an opportunity. The last decade has been terrific for traditional balanced portfolios, but with the potential for a regime shift on the horizon as the battle between monetary and fiscal policy becomes fierce, portfolio construction needs to evolve alongside financial markets. For investors that have been caught off guard with the current bout of inflation and the associated effect on their portfolios, the Viewpoint Commodities strategy offers an efficient and intelligent way to gain direct access to broad-based commodity exposure, improving the versatility of investment portfolios.
ABOUT THE AUTHOR

DISCLAIMER:
This blog and its contents are for informational purposes only. Information relating to investment approaches or individual investments should not be construed as advice or endorsement. Any views expressed in this blog were prepared based upon the information available at the time and are subject to change. All information is subject to possible correction. In no event shall Viewpoint Investment Partners Corporation be liable for any damages arising out of, or in any way connected with, the use or inability to use this blog appropriately.