From the Desk of Our CIO

Schrödinger’s Strait: A Mid-Year View on the Multipolar Cycle

June 11, 2026

Executive Summary

The first half of 2026 has been a reminder that markets are increasingly being shaped by forces beyond traditional economics. Geopolitical tensions in the Middle East, massive investment in artificial intelligence, and a changing interest-rate outlook have all played a role in determining where capital is flowing and which assets are outperforming.The house view we outlined in January has largely held up. Commodities have been one of the strongest-performing asset classes, international markets have generally outperformed U.S. equities, and bonds have struggled in a world where inflation remains stubborn and economic growth has stayed resilient.

The biggest story of the year has been the conflict surrounding the Strait of Hormuz, one of the world’s most important energy corridors. While the worst-case scenarios have not materialized, the situation highlights a larger trend, which is that in a more fragmented and multipolar world, geopolitical events are increasingly influencing commodity prices, inflation, and investment returns.

At the same time, the AI boom is transforming financial markets. Companies are investing unprecedented amounts of capital into data centres, computing infrastructure, and technology development. While this spending could drive future productivity gains, it is also changing how corporations use their cash, potentially reducing the share buybacks that have supported stock markets for much of the past two decades.

A third key risk is monetary policy. Markets began the year expecting interest-rate cuts, but stronger-than-expected economic growth and persistent inflation have shifted the conversation toward the possibility of higher rates instead. If that happens, both investors and businesses may face tighter financial conditions than anticipated.

For investors, the core themes remain largely unchanged. We continue to favour commodities as a long-term portfolio diversifier, maintain a preference for international equities relative to the U.S., and remain cautious on traditional fixed income. Within equities, we believe quality businesses that generate strong cash flow and return capital to shareholders are likely to be better positioned than companies requiring significant ongoing investment.

The second half of 2026 will likely continue to be defined by the interaction between geopolitics, AI-driven investment, and central bank policy. While the risks have evolved since January, the need for diversified, resilient portfolios has not.


Introduction

Six months into the year, the base case set out in Running Hot, Growing Uneven from January has played out roughly as anticipated. Growth has stayed resilient, inflation has been sticky, though policy support for the K-shaped economy has not materialized. Instead of U.S. consumer affordability issues being addressed, kinetic action against Iran exacerbated them.

In a multipolar world, the questions for the back half of 2026 are different than they were in January. Three sequential risks now sit in our base case. A longer Hormuz stalemate doesn’t necessarily risk global shortages and severe demand destruction, but elevated energy prices can still filter through to consumers and dent demand. An AI-capex cycle that is shifting the corporate sector from net buyer to net seller of equity. And a Federal Reserve that may need to lean hawkish even as the consumer story softens. The framework that we laid out in January — overweight commodities, overweight international equities relative to U.S. equities, underweight dollar-neutral long duration, and utilize tactical multi-asset portfolio construction — is still intact, but the risks have just shifted.


1. Six Months In – How the January Outlook Has Aged

Following up on our January outlook, three of the pillars have endured, two have evolved, and one has aged poorly.

The house views from early January has held up well throughout the first half of the year. Commodities as an overweight portfolio allocation have been dominant and helped to cushion some of the risk-off sentiment markets witnessed in March after the beginning of the war in Iran. The Bloomberg Commodity Total Return Index is up roughly +21% in USD year-to-date, lifted by the energy complex from the Iran war, as well as broader supply tightness in industrial metals and grains.

An underweight stance towards fixed income has also played out well, with global bonds only up +1.1% in CAD terms, positive nominal carry but an opportunity cost in portfolios relative to equities and commodities.

On equities, the call to prefer international over U.S. in common-currency terms remains in the green with MSCI ACWI ex-US +12.3% versus the S&P 500 +9.7% in CAD. The path has been more interesting than the headline, with international equities building up a lead during the Q1 U.S. dollar weakness and tech softness, then compressed almost to zero through the April to May period with the Strait of Hormuz closure as international equities were hit harder on higher imported energy costs than the U.S. International equities have begun to re-open their spread as the stress in the Middle East recedes, and we get closer to some sort of phased re-opening for the Strait.

Figure 1
The Federal Reserve story has run differently than we expected, but in a direction that strengthens the constraint-based framework we set out in The Warsh Reckoning. More consequential than the Chair is the committee’s path for interest rates, and markets entered 2026 with the expectation the Fed would cut twice within the year. The Fed has delivered none so far, holding the overnight rate steady at 3.50%-3.75%. The April FOMC meeting drew four dissents, reinforcing a divided committee where a directionally dovish Fed chair may have a hard time persuading other FOMC members of that view. The committee is more divided than it has been in a generation, and the median voter has rotated hawkish via the regional bank rotation.

On tariffs, our view that peak tariff risk is now behind us has continued to hold up well. The Supreme Court struck down the IEEPA tariffs in February, and although the administration invoked Section 122 to replace the lost revenue, the instant dial of IEEPA has been removed, and with it a lot of headline volatility. The tariff rate has compressed, and while there will likely always be some form of tariffs under the new architecture of sections 232 and 301, the relative stability compared to the IEEPA framework should be a net benefit for corporate planning.

The pillar that has aged the worst is affordability. The January piece described a list of levers the administration was likely to pull (housing policy, credit-card rate caps etc.) and there was very little, if any, follow-through. Once the Iran action began at the end of February, the affordability agenda quietly slipped off the front page. We highlighted the pivot in our note Iran, Midterm Incentives, and the Energy Risk Premium — that “if domestic economic messaging is faltering… the administration could be tempted to lean more heavily on foreign policy achievements to reset the narrative.” The administration’s own framing has since made the pivot explicit. Asked whether Americans’ financial concerns were motivating him to strike a deal with Iran, the President answered, “not even a little bit,” adding that he doesn’t “think about Americans’ financial situation”. Whatever the merits of that prioritization, the K-shaped consumer thesis from January is now a structural feature of the cycle rather than a political problem someone is trying to solve (for now).

The dominant pillars of the January positioning — overweight commodities, underweight fixed income, geographic diversification — remain intact. What has shifted is the source of the risk. Less potential for inflation overshoot from broad policy stimulus, but more from a slow-burn fragmented geopolitical environment with AI infrastructure spending fanning those flames.


2.  Schrödinger’s Strait

The war in Iran has now settled into an unstable equilibrium, and financial markets have generally moved on from pricing it as an ongoing risk to overall sentiment. A formal U.S.-Iran ceasefire was previously in place, but the framework is fragile as skirmishes between both sides continue. A durable off-ramp has not yet been negotiated, but markets believe it is right around the corner.

While markets have become immune to the twitter battles between the U.S. administration and the IRGC, the traffic data through the Strait of Hormuz tells the story more cleanly than any tweets or Axios articles. Traffic fell from 96 crossings on February 28, the eve of the U.S. and Israeli strikes, to zero on March 19.  Crossings have since stabilized at a fragile baseline averaging just two to four crossings per day, or roughly two percent of normal, sustained by Iranian permit requirements and selective U.S. naval escorts.

Figure 2

The IRGC has formally prohibited any vessel travel to and from U.S., Israeli, or allied ports. Iran has set up a parallel transit channel north of Larak Island and is charging tolls, with ships reportedly paying up to $2 million for passage. Chinese-owned and Iranian shadow-fleet tankers move with relative freedom; everyone else is either gated, paying for transit, or moving under U.S. naval escort. Schrödinger’s Strait is how we’ve been thinking about the framing – open and closed at the same time, depending on whose flag is flying on the vessel.

Despite the Strait still operating well below normal volumes, there have been mitigating circumstances that have helped to keep energy prices lower than they otherwise would be. Verified dark transits, vessels disabling their AIS transponders to avoid detection, suggests the official transit count materially understates actual flow. The practice is no longer confined to shadow-fleet operators sustaining Iranian and Russian exports under sanctions, with mainstream commercial vessels carrying Iraqi and UAE crude also adopting the same tactics. Bypass pipelines in Saudi Arabia and the UAE have been able to restore some of the lost volume, while the G7 Strategic Petroleum Reserve releases have also helped to buffer crude inventories. But it’s really been China doing the heavy lifting to keep energy prices somewhat anchored, drawing on their own stockpiles and reducing their normal imported volumes.

The IEA coordinated SPR release was pledged at 426 million barrels over 120 days, roughly 3.5 mb/d equivalent, of which the U.S. share is 172 million barrels (about 1.4 mb/d). Actual U.S. SPR drawdowns have been lower than what was pledged, but this flow has been accelerating in recent weeks and the 4-week moving average stands at roughly 1.3 mb/d.

China, over the same window, has reduced its demand by 5 mb/d. Seaborne crude imports fell from 11.39 mb/d in February to 6.36 mb/d in May, with refinery throughput held at approximately 13.5 mb/d by drawing on China’s own strategic stockpiles of around 1.4 billion barrels. In effective flow terms, China’s demand restraint has more of the heavy lifting than the IEA’s pledged SPR release.

This is a good example of a multipolar world where western inventory releases have been helpful but ultimately underwhelming, while China’s ability to swing the marginal barrel from a demand perspective has helped to contain energy prices from spiraling out of control. While China has built the necessary stockpiles to absorb this geopolitical shock in the short-term, it will ultimately continue to accelerate the electrification movement in Asia, increasing demand for coal and renewables, energy feedstocks that are more accessible and less exposed to chokepoint delivery risk.

While the anchoring of oil prices has been more beneficial for the global economy than some commodity forecasters had suggested, it doesn’t mean the energy shock has been fully absorbed. WTI crude is at $88 per barrel, up roughly +54% year-to-date. Brent is at $92, up +52%. European TTF natural gas is at €49.50 per MWh, up +76%.

The transmission to consumer prices is starting to become visible in the lagged numbers. Headline CPI accelerated to 4.2% year-over-year in the most recent May print, while core inflation moved up to 2.9%. The one-year inflation swap is at 3.01%, +77 basis points year-to-date, while the five-year forward five-year inflation swap is essentially flat at 2.40%. Front-end breakevens are pricing an energy-driven inflation impulse, while long-end expectations remain anchored. This is not a regime change for long-term inflation expectations, but a slow-burn energy pass-through to the consumer and enough to materially complicate the Federal Reserve’s monetary policy path.

Figure 3
Tactically, we expect a commodity pullback in the short term as the worst-case Hormuz scenarios continue to fade, but the structural overweight remains intact. This is the kind of pullback to add to existing positions or to establish new positions at improved entry levels. We continue to believe that commodity exposure in investment portfolios is structural, and there will be an ongoing geopolitical risk premium baked into global commodity prices in a multipolar world.
 

3. From Buybacks to Capex Burn

U.S. growth has stayed resilient through the first half of the year, with the Atlanta Fed GDPNow tracker sitting at roughly +3% annualized for the second quarter and the S&P 500 is within striking distance of all-time highs even with elevated geopolitical risk. Financial participants have moved on from geopolitical risk to embracing AI productivity gains, and earnings have helped to support the increase in equity prices. While the underlying vibes are optimistic, investors should be turning their attention to how durable the cycle is.

Figure 4
Neil Dutta at Renaissance Macro recently highlighted how the dominant growth engine in the U.S. has transitioned to AI-capex spending and outlined the size of growth contribution. AI-related capital spending contributed roughly +1.0 percentage point of U.S. GDP growth over the past two quarters, compared to +0.7 percentage points from consumer spending. Business investment in this complex now sits at around 6% of GDP. The U.S. imported roughly $120 billion of AI-related capital goods in March alone, and approximately $350 billion in the first quarter.

That capex impulse is now being financed, in part, by the equity market itself. For most of the post-financial-crisis era, the U.S. corporate sector has been a net buyer of equities, with buybacks running at $1 trillion-plus annually. Robert Buckland at Citi in 2003 coined the term de-equitisation, and corporate equity demand has exceeded supply every year since, with the S&P 500 share divisor peaking in 2003 and grinding lower ever since. That tailwind, more than any single factor, has supported U.S. equity valuations for two decades.

The buyback revolution is now being reversed by the AI capex cycle. Alphabet recently announced an $80 billion equity raise, Meta is reportedly said to be considering a similar equity raise , SpaceX is set to IPO at the end of this week with a $75 billion raise, and both Anthropic and OpenAI have filed confidential S-1s. The numbers around equity supply are likely to add up quickly.

The structural number underneath all of this is the cash flow math. The four largest hyperscalers are now spending close to 100% of operating cash flow on capex, against a long-term historical average of roughly 40%, according to UBS. Buybacks are being squeezed simultaneously. Bloomberg reported in February that quarterly buybacks from this cohort were at their lowest run rate since 2019. The culmination of this is that the corporate balance sheet is no longer the marginal bid, it has become the marginal seller.

A wave of new equity issuance may look bearish, but it does not necessarily signal an immediate downturn. Compared with two decades of share retirement, the new supply remains relatively small, and the IPO market can still absorb it if sentiment stays strong. The bigger risk is timing. Goldman Sachs research cited by John Authers suggests that in large-cap IPOs with very low initial floats, only about 7% of shares trade at listing, but this rises to roughly 54% after two years. SpaceX, Anthropic, and OpenAI could follow a similar path. That implies the supply coming in 2026 may be manageable, but as lockups expire, the heavier flow in 2027 and 2028 could turn the de-equitisation tailwind into a liquidity headwind.

And valuations aren’t at euphoric levels by any means, with the S&P 500 forward 12-month P/E having decompressed this year from roughly 25.7x at year-end 2025 to 22.4x today. The index is within reach of all-time highs not because investors are paying higher multiples for the same profits, but because earnings expectations have moved up. However, concentration risk remains the issue. The mega-cap AI complex is doing disproportionate work on both the upside and the downside, and a single negative earnings shock in the Mag 7 names would mark the index materially more than it should. This is the same concentration concern we raised in Laying the AI Rails, and it has only sharpened as the capex cycle has accelerated.

The implication for portfolios is to lean away from passive cap-weighted U.S. exposure and toward quality and yield factors, gaining more exposure to businesses that generate cash and return it to shareholders, rather than businesses that consume cash to fund infrastructure. The AI thesis itself is intact, and we’re not outright bearish on the story, but the way it is being financed is changing, and the flow-of-funds backdrop is one half of what we call two-track tightening of financial conditions. The other half of the story is the Federal Reserve.


4. From Cuts to Hikes

In addition to the AI capex cycle absorbing market liquidity through equity supply, another risk is the Federal Reserve starting to tilt hawkish and raising short-term interest rates.

So far this year the equity market has continued to power higher and has done so without help from the Fed.  Market participants entered the year pricing in roughly two cuts, one by the FOMC meeting later this month, and another into the end of the year. Not only have there not been any interest rate cuts this year, but the April meeting produced four dissents, the most since 1992, and the regional rotation has shifted the median voter hawkish, with Hammack at Cleveland and Logan at Dallas joining the voting roster. And after last Friday’s strong employment report, market participants are now fully pricing in one hike by year-end, a dramatic turnaround in monetary policy conditions.

Figure 5
Even with Warsh taking the helm as chair of the FOMC, it’s going to be hard for him to wrangle the rest of the committee into viewing the macro backdrop as one that warrants lower interest rates. The conditions that would justify it are absent, unless you have high confidence that AI productivity gains will lead to lower inflation and a soft job market, something that isn’t currently borne out in the incoming data. The Bloomberg U.S. Financial Conditions Index has rebounded since the Iran War and is looser than it was at the beginning of the year. M2 money supply is growing at +4.7% year-over-year, illustrating that credit and lending conditions are accommodative. The labour market is softer than 2022 but not soft enough to push a divided FOMC into easing, especially with energy prices elevated as Iran conflict and the closure of the Strait of Hormuz drags on.

Figure 6
Figure 7
As we argued in The Warsh Reckoning, the constraint-based framework matters more than the chair’s predilection. Warsh is only one vote of twelve, and he’s losing a dovish ally in Stephen Miran who will need to step off for Warsh to join the board. Miran cast a dovish dissent at every one of the six FOMC meetings he attended during his short tenure — an extraordinarily rare streak in modern Fed history. If the labour market stays warm and inflation stays sticky from the Hormuz pass-through effects, the committee may be forced into a hawkish hold even against the chair’s directional preference. This makes the summary of economic projections in the June FOMC meeting a key area of focus for investors and could pressure short-term rates higher if the committee continues to skew hawkish.

The interaction between strong growth that turns the Fed hawkish along with greater equity issuance makes an asymmetric back-half of 2026. A hawkish Fed move shrinks the pool of marginal equity buyers at precisely the moment the supply ramps. The asymmetry of small upside if both tracks ease, but material downside if both tighten, argues for a more defensive equity stance even with the constructive near-term sentiment.


5. Positioning

Our house view, which we incorporate into separately managed portfolios, but does not influence our pooled fund model, carries forward the framework that worked through the first six months, with two conditional layers.

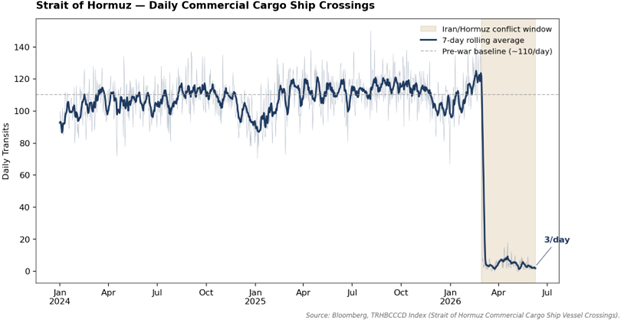
We remain overweight commodities. The structural case is reinforced by the multipolar world where commodities will have a structural geopolitical risk premium embedded as nation states look to fortify commodity supply chains. The near-term tactical pullback we expect as the worst-case Hormuz scenarios fade is an opportunity to add to existing positions or establish new ones at improved entry levels.

We remain overweight international equities relative to the U.S. in common-currency terms. The conditional caveat is the U.S. dollar. A meaningfully more hawkish Fed move alongside USD strength would push us toward a more neutral geographic stance, since the common-currency tailwind that has driven the year-to-date international lead would partially reverse.

Within U.S. equities, we continue to tilt away from cap-weighted exposure and toward quality and yield factors. Businesses that generate cash and return it to shareholders, rather than businesses that consume cash to fund AI infrastructure, are the right exposures heading into a back half defined by two-track tightening of financial conditions.

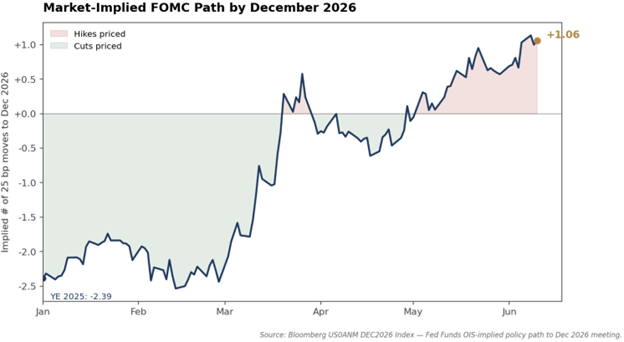
Fixed income remains underweight in aggregate. The conditional move is long duration. If the Fed pivots hawkish and the real economy slows in response, the curve will likely flatten or invert, and long duration becomes the cleaner recession hedge. While we’re seeing early signs of curve flattening, neither condition is fully locked, and the June FOMC meeting and dot plot are important signals to watch.

Our discretionary views don’t factor into portfolio construction for our pooled funds but can be helpful as investors think about their holistic portfolio construction. The Viewpoint pooled funds are rules-based and adaptive to the evolving market environment, adjusting capital allocations based on volatility, correlations, and in the case of the multi-assets, additional quantitative overlays.

For the Viewpoint Diversified Commodities (VCOM) strategy, the most meaningful capital allocation change through the first half has been a large reduction in exposure to the energy sector, with most of the change concentrated in thermal coal. Heading into the start of the year the VCOM strategy was overweight energy relative to historical model averages, and after the breakout of the Iran war and the pop higher in both price and volatility, the strategy reduced capital exposure to keep the risk allocation from energy markets stable, taking profits on the price rise. The capital pulled out of energy has been redeployed across the remaining sectors, with the largest increases accruing to livestock and grains. The shift is signal driven rather than discretionary, with the strategy responding mechanically to the volatility re-rating in energy through the first quarter. The result, however, leaves the strategy well positioned for any weather or fertilizer-related spillover from Hormuz in the back half of 2026 through its exposure to agriculture.

For Viewpoint Enhanced Global Equity Yield (VEY), the strategy quantitatively screens for quality and shareholder yield characteristics, so it already tilts away from pure market cap weightings. Within the screened opportunity set, the strategy then uses a risk parity approach to determine capital weightings so that each equity sector (as well as individual equities within the sector) contributes the same amount of risk to the portfolio. Year-to-date, as volatility and correlations have shifted, the strategy has added the most capital to the energy and utilities sectors, while decreasing capital exposure to materials and financials. While the strategy has added slightly to the tech sector year-to-date, information technology sits at 8.3%, a material underweight relative to the 32% weighting in the global equity (ACWI) benchmark.

Viewpoint Global Multi-Asset (VMA) has materially de-risked through the first half of 2026, with strategy leverage starting the year at 158%, moving close to 250% ahead of the Iran conflict, and then de-risking back down to 124% today. On a normalized basis, the active capital allocation tilts have been into commodities, funded by a reduction in nominal rates as time-series momentum signals shifted away from government bonds — with U.S. and Emerging Market nominal bonds the two largest sub-allocation reductions of the half. On a geographic basis, Japan has emerged as the relative winner, holding its capital allocation relatively steady as U.S. and Emerging Market exposures came down more aggressively.

The Viewpoint Enhanced Global Multi-Asset strategy has de-levered even more substantially than VMA, which is a function of having a higher volatility target than VMA. Gross leverage of the strategy has moved from 382% to 269%, decently below the historical model average. Both multi-asset strategies are now in a more defensive position than historical model averages, responding to the higher volatility across financial markets. On a normalized basis, the active rotation has been similar to VMA, with a large capital rotation into commodities and inflation-linked rates, funded predominately by a reduction in international nominal sovereign bonds. Within the quantitative overlays, the commodity long/short overlay has been adding to agricultural commodities like canola and cotton, but also to energy products like WTI and Dutch Natural Gas. This capital allocation is obviously different than the behaviour of the VCOM strategy, with the long/short overlay harvesting trend signals to increase its exposure to energy, while the portfolio construction of VCOM harnesses a mean reversion tilt within the risk parity framework.


Closing

The early 2026 base case has aged well, but the second half is defined by a different set of risks than the ones we faced in January. The geopolitical fragmentation from the Hormuz episode is another structural example of a multipolar world, not a one-off. Both the Fed and the upcoming equity issuance will likely lead to tighter liquidity into year-end than they were at the start of the year. In a multipolar world, we continue to favour portfolios that can withstand volatility rather than reach for it.


Happy Investing!

Scott Smith

Chief Investment Officer

ABOUT THE AUTHOR

Scott Smith, CFA
CHIEF INVESTMENT OFFICER

Scott is responsible for leading the development of the macro research behind VIP’s models, Scott’s deep expertise in foreign exchange and global financial markets is instrumental in developing disciplined, rules-based, innovative portfolios that deliver value for VIP’s investors.

DISCLAIMER:

This blog and its contents are for informational purposes only. Information relating to investment approaches or individual investments should not be construed as advice or endorsement. Any views expressed in this blog were prepared based upon the information available at the time and are subject to change. All information is subject to possible correction. In no event shall Viewpoint Investment Partners Corporation be liable for any damages arising out of, or in any way connected with, the use or inability to use this blog appropriately.

Newsletter